I configured the Graphite module on Icinga2 and Icingaweb2.
It works and some graphs are shown on Icingaweb2, but I realized that not all performance data are exported to Graphite.
For example, these are the performance data for the LinuxFabrik ping plugin:
[
    "transmitted=5;;;0;",
    "received=5;;;0;",
    "duplicates=0;;;0;",
    "checksum_corrupted=0;;;0;",
    "errors=0;;;0;",
    "packet_loss=0%;;;0;100",
    "time=806ms;;;0;",
    "rtt_min=20.262ms;;;0;",
    "rtt_avg=20.852ms;;;0;",
    "rtt_max=21.357ms;;;0;",
    "rtt_mdev=0.427ms;;;0;"
]
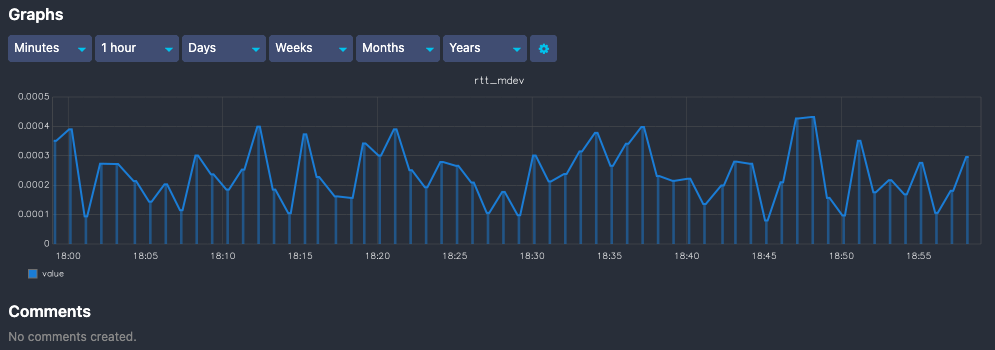
But I see only the rtt_mdev metric:
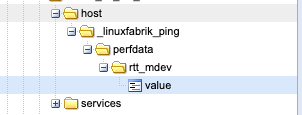
This reflects what is indexed on Graphite:
This problems happens on basically all plugins, and some plugins are completely missing on Graphite, even if they are generating perfdata, for example the disk-usage plugin:
[
    "/-usage=3911393280B;;;0;17864896512",
    "/-total=17864896512B;;;0;17864896512",
    "/-percent=23.1%;;;0;100",
    "/boot-usage=161774592B;;;0;467879936",
    "/boot-total=467879936B;;;0;467879936",
    "/boot-percent=36.9%;;;0;100",
    "/tmp-usage=90112B;;;0;3851608064",
    "/tmp-total=3851608064B;;;0;3851608064",
    "/tmp-percent=0.0%;;;0;100",
    "/var-usage=3954708480B;;;0;33631780864",
    "/var-total=33631780864B;;;0;33631780864",
    "/var-percent=12.4%;;;0;100",
    "/var/lib/postgresql-usage=2157281280B;;;0;210237366272",
    "/var/lib/postgresql-total=210237366272B;;;0;210237366272",
    "/var/lib/postgresql-percent=1.1%;;;0;100"
]
Could you help me to find out where I’m wrong, please?
Thank you!