Is there a reason why graphite does not show the graph of the metrics when a host/service is down or critical?
Can we somehow “force” to show the graph even if the last check did not deliver any metrics?
Sometimes it would be useful to know when was some host/service online on the last hours, even if it is down right now…
The graph should appear sans any timepoints with null data. Are you saying the graph doesn’t even appear in Icinga at all during periods of downtime? What do you see when you login to Graphite’s own web portal specifically?
@blakehartshorn: If I for example disconnect a machine, on the next check the graph disappears from the icingaweb2 host/service page, and it just says: CRITICAL - Host Unreachable (w.x.y.z). Nothing below, just the next section Problem handling.
The graph on the graphite’s interface site is fine, and as it could be expected (and you said), it shows no data when the plugin didn’t deliver anything.
Maybe there’s an option somewhere to only show the graph if the reply delivered some metrics. That would be convenient for plugins/services that do not deliver any metrics, but what about the plugins that do deliver, but not in certain states?
Are you on the official Icinga graphite module 1.1.0, or the third party one? That could make a difference.
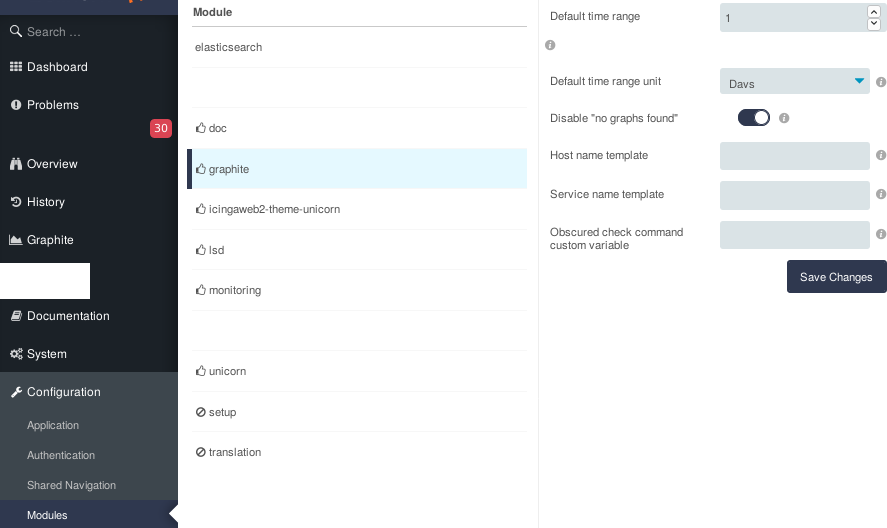
I’ve never seen this happen on my own setup, but just how big of a gap are we talking here? The default view is 1 day. From Configuration > Modules > Graphite > Advanced mine looks like this.
Wow!!! how cool!
For some reason my deployment scripts used a fully obsoleted fork.
I am amazed with how much better it has gotten
And indeed, in the new version the graph is there without value, and so many other details with such a fine polishing.
Thank you very much!