redbob365
(*** Redbob)
1
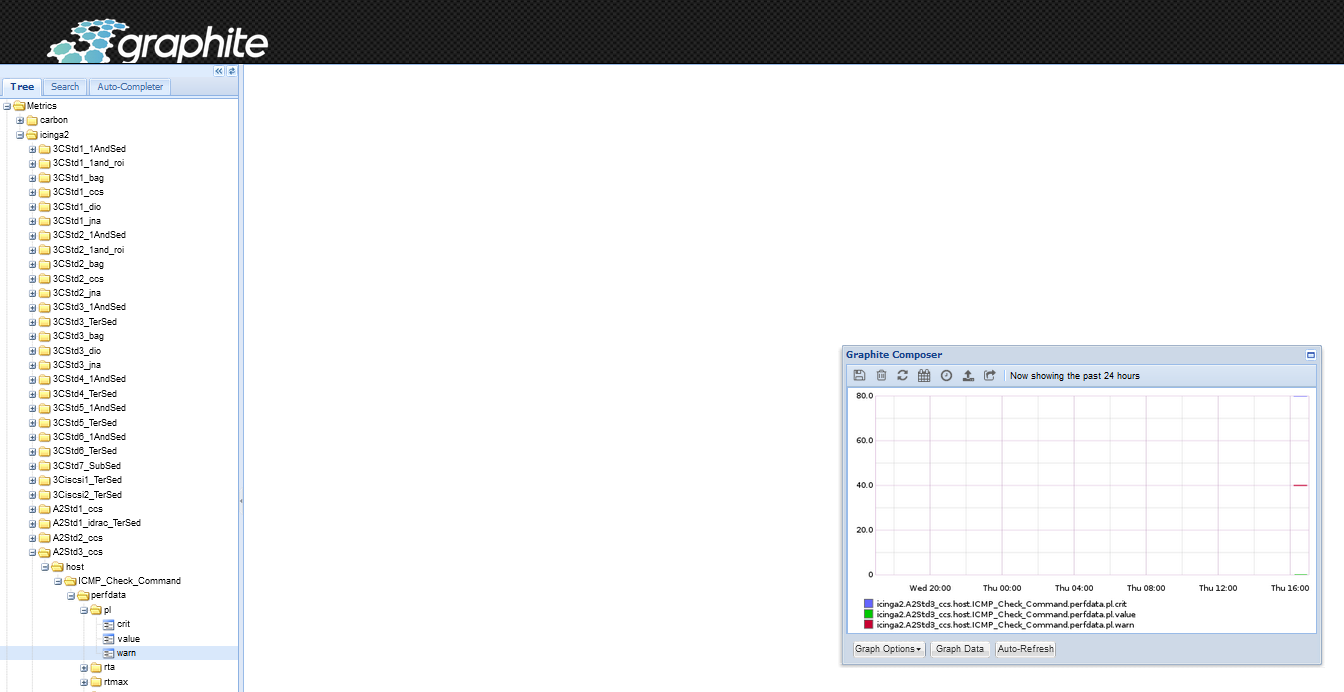
I installed Graphite according to this tutorial and it’s working like a charm, as you can see at this image:
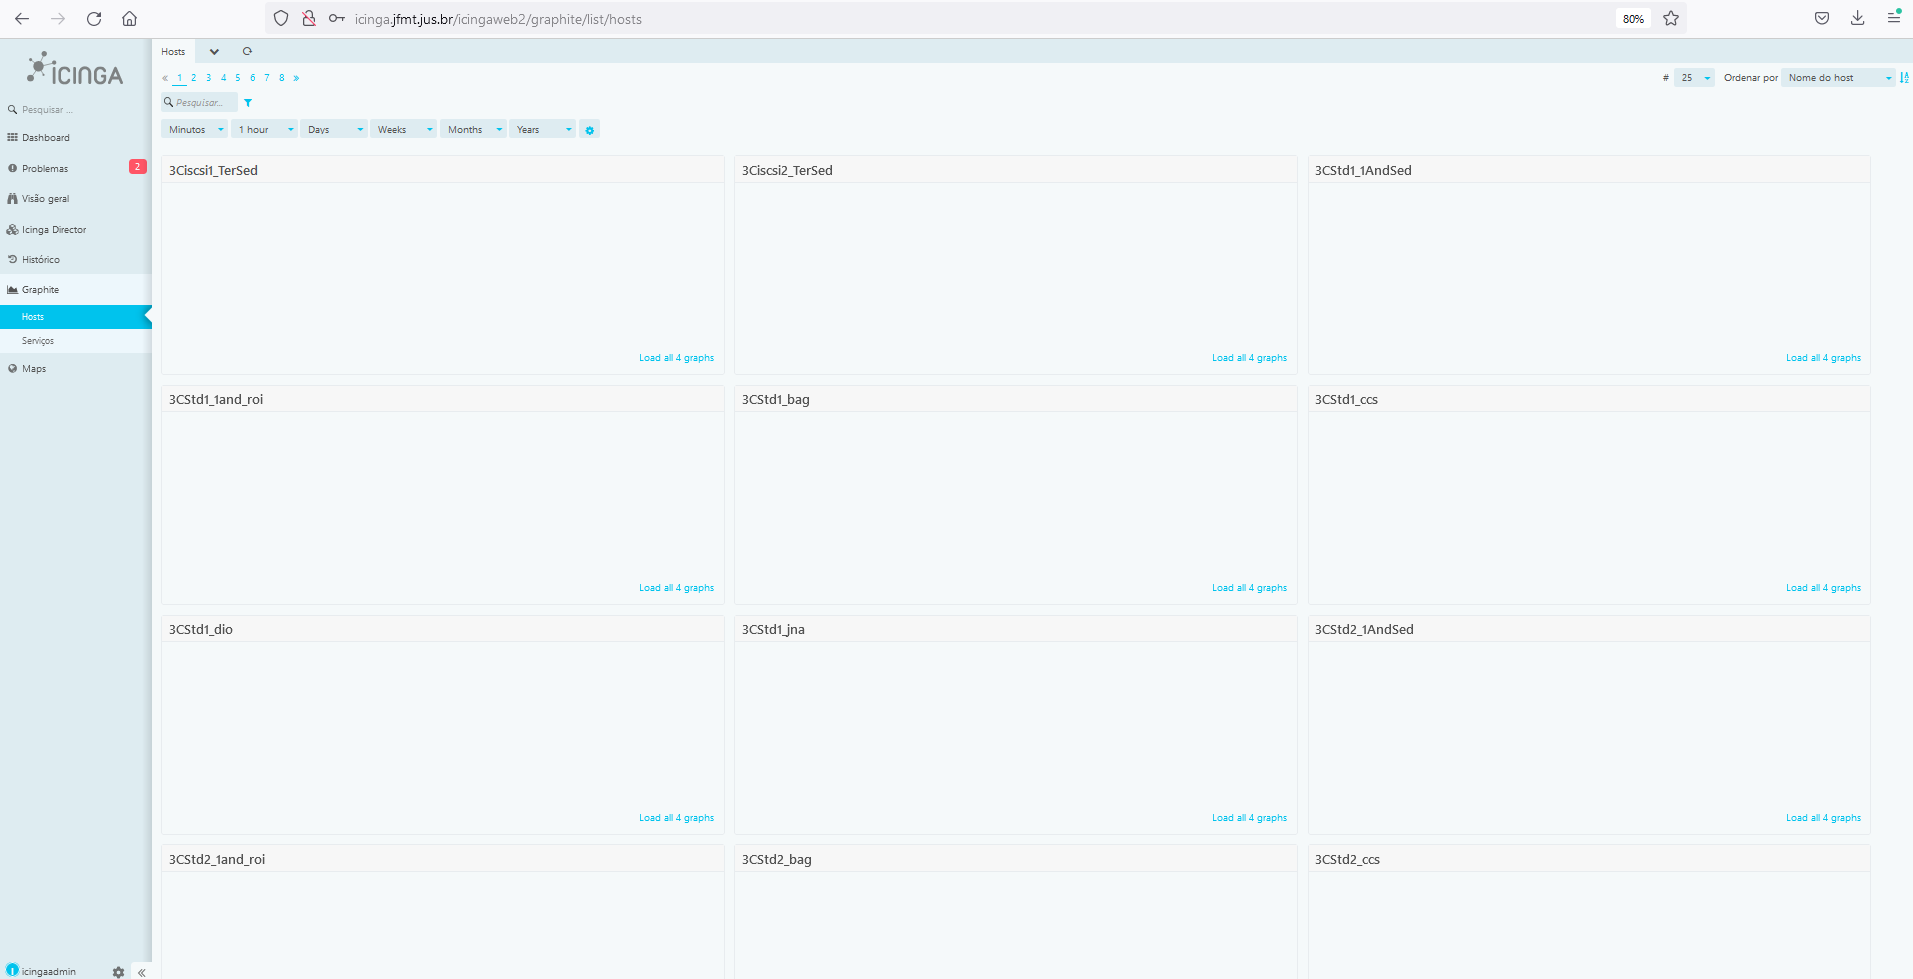
But in my icingaweb dashboard all graphs are blank!
That’s /etc/icinga2/features-enabled/graphite.conf content:
object GraphiteWriter "graphite" {
  host = "172.24.3.97"
  port = 2003
  enable_send_thresholds = true
…and /etc/icingaweb2/modules/graphite/config.ini content:
[graphite]
url = "http://172.24.3.97:8000/"
insecure = "1"

[ui]
default_time_range = "1"
default_time_range_unit = "hours"
disable_no_graphs_found = "1"
redbob365
(*** Redbob)
2
Solved! I enabled perfdata and statusdata icinga2 features:
icinga2 feature enable perfdata statusdata
Hi,
I have the same problem and I tryed to enable the perfdata and statusdata but the statusdata runs on error after icinga servie restart.
[2024-03-21 10:33:07 +0100] information/cli: Icinga application loader (version: r2.14.2-1)
[2024-03-21 10:33:07 +0100] information/cli: Loading configuration file(s).
[2024-03-21 10:33:07 +0100] critical/config: Error: Error while evaluating expression: Tried to access undefined script variable 'StatusDataWriter'
Location: in /etc/icinga2/features-enabled/statusdata.conf: 7:8-7:23
/etc/icinga2/features-enabled/statusdata.conf(5):  */
/etc/icinga2/features-enabled/statusdata.conf(6):
/etc/icinga2/features-enabled/statusdata.conf(7): object StatusDataWriter "status" { }
                                                         ^^^^^^^^^^^^^^^^
/etc/icinga2/features-enabled/statusdata.conf(8):
/etc/icinga2/features-enabled/statusdata.conf(9):
[2024-03-21 10:33:07 +0100] critical/cli: Config validation failed. Re-run with 'icinga2 daemon -C' after fixing the config.