Hello everyone, I just configured icinga and graphite.
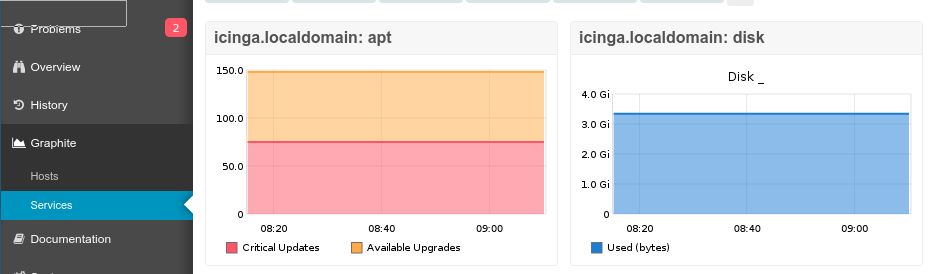
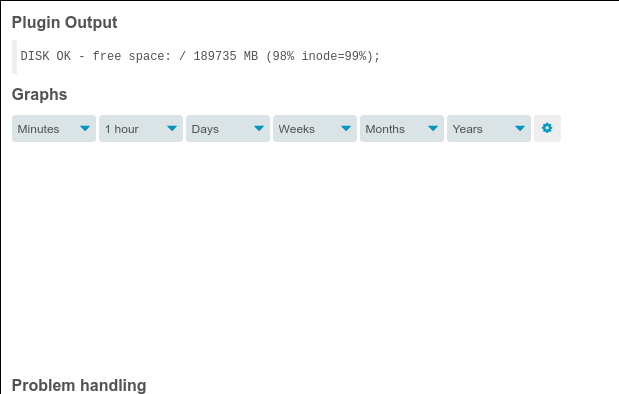
I can see graphs in the graphite tab but not in service details (I see time related comboboxes and a white graph, not even with lines, etc…)
I would like to know if it’s a known issue or if I did something wrong?
please share more details about your environment and versions, e.g. Icinga Web 2, Graphite module, Browser, etc.
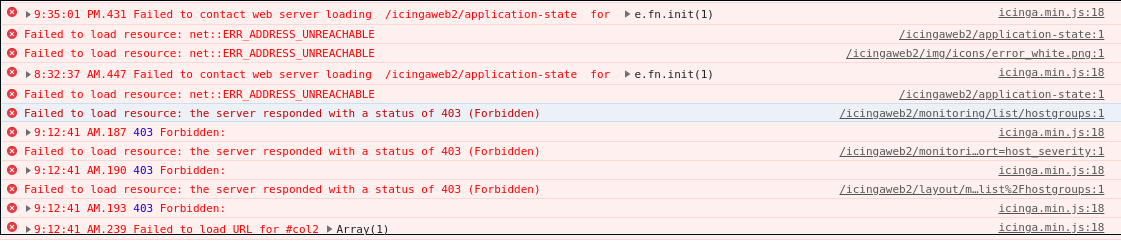
Also, is there anything visible in the apache logs and the browsers developer console?