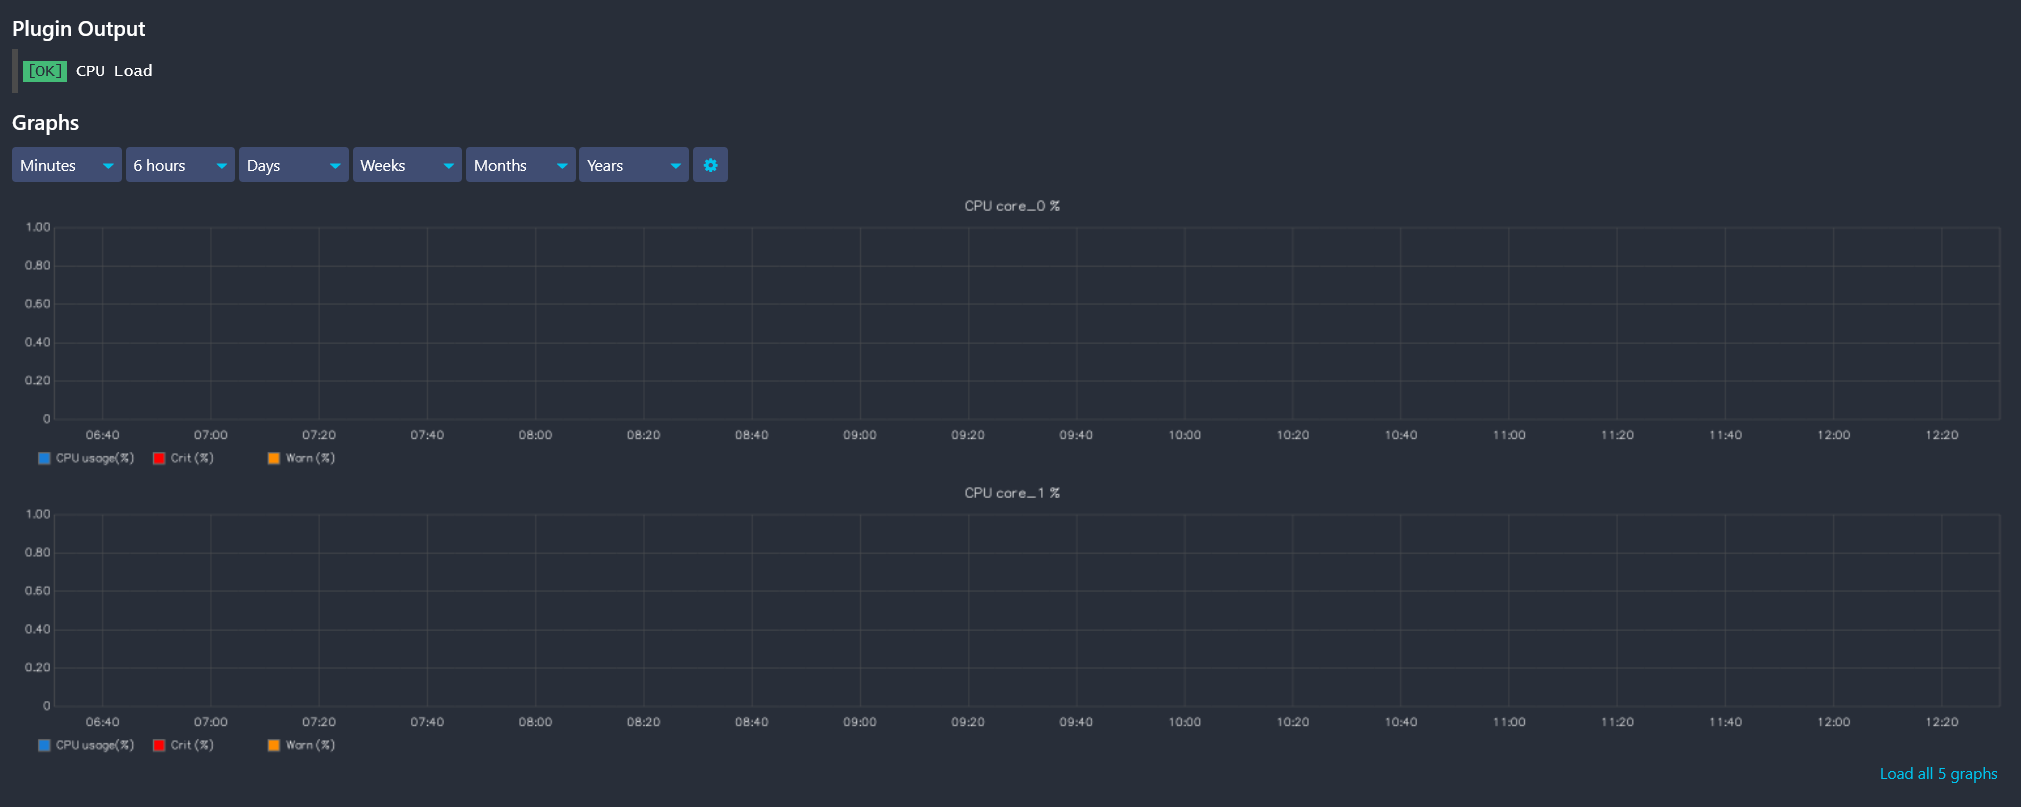
Graph debug:
+ Icinga check command: 'Invoke-IcingaCheckCPU'
+ Obscured check command: NULL
+ Applying templates for check command 'Invoke-IcingaCheckCPU'
++ Applying template 'load-windows'
+++ Fetched 5 metric(s) from 'http://<graph server>/metrics/expand?query=icinga2.server_name_here.services.CPU_Load.Invoke-IcingaCheckCPU.perfdata.%2A.value'
+++ Fetched 5 metric(s) from 'http://<graph server>/metrics/expand?query=icinga2.server_name_here.services.CPU_Load.Invoke-IcingaCheckCPU.perfdata.%2A.crit'
+++ Fetched 5 metric(s) from 'http://<graph server>/metrics/expand?query=icinga2.server_name_here.services.CPU_Load.Invoke-IcingaCheckCPU.perfdata.%2A.warn'
+++ Excluded 0 metric(s)
+++ Combined 15 metric(s) to 5 chart(s)
+ Applying default templates, excluding previously used metrics
++ Not applying template 'multi2-host'
++ Applying template 'multi2-service'
+++ Fetched 0 metric(s) from 'http://<graph server>/metrics/expand?query=icinga2.server_name_here.services.CPU_Load.Invoke-IcingaCheckCPU.perfdata.%2A.%2A.value'
+++ Excluded 0 metric(s)
+++ Combined 0 metric(s) to 0 chart(s)
++ Not applying template 'multi3-host'
++ Applying template 'multi3-service'
+++ Fetched 10 metric(s) from 'http://<graph server>/metrics/expand?query=icinga2.server_name_here.services.CPU_Load.Invoke-IcingaCheckCPU.perfdata.%2A.%2A.%2A.value'
+++ Excluded 10 metric(s)
+++ Combined 0 metric(s) to 0 chart(s)
++ Not applying template 'default-host'
++ Applying template 'default-service'
+++ Fetched 5 metric(s) from 'http://<graph server>/metrics/expand?query=icinga2.server_name_here.services.CPU_Load.Invoke-IcingaCheckCPU.perfdata.%2A.value'
+++ Excluded 5 metric(s)
+++ Combined 0 metric(s) to 0 chart(s)
++ Applying template 'disk-health-diskwritessec'
+++ Fetched 0 metric(s) from 'http://<graph server>/metrics/expand?query=icinga2.server_name_here.services.CPU_Load.Invoke-IcingaCheckCPU.perfdata.%2A.ifw_diskhealth.diskwritessec.value'
+++ Fetched 0 metric(s) from 'http://<graph server>/metrics/expand?query=icinga2.server_name_here.services.CPU_Load.Invoke-IcingaCheckCPU.perfdata.%2A.ifw_diskhealth.diskreadssec.value'
+++ Excluded 0 metric(s)
+++ Combined 0 metric(s) to 0 chart(s)
Template:
[load-windows.graph]
check_command = "load-windows"

[load-windows.metrics_filters]
value = "$service_name_template$.perfdata.load.value"

[load-windows.urlparams]
areaAlpha = "0.5"
areaMode = "all"
lineWidth = "2"
min = "0"
yUnitSystem = "none"

[load-windows.functions]
value = "alias(color($metric$, '#1a7dd7'), 'Load (%)')"
I’m just really not sure where to start with this one. All other graphs are working, to my knowledge, and the data shows up on the graphing server just fine.