Hi, we are currently running Icinga 2 with Graphite and have a strange issue with our graphs displaying the value incorrectly. Let me give two examples:
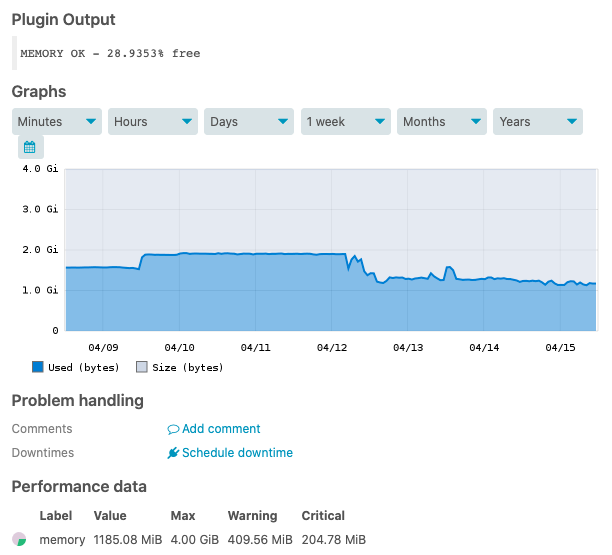
Memory: The plugin output and performance data values are correct, we have 28% free. However the graph value displays “Used (bytes)” at 28%.
Basically the plugin output value is represented on the graph correctly but displaying as “used” instead of “free”. I don’t believe attempting to manually amend the label from the enabled module is the correct approach. So any advice would be greatly appreciated.
Since the values themselves are correct and only the labels are wrong, you
may find the solution by checking the templates in the templates-directory, (e.g.) /etc/icingaweb2/modules/graphite/templates/
for related configurations (hint: grep for the checkcommand).
This can occur very quickly, especially if the checks allow very different behavior but the templates only take one of the cases into account, like checking for used/free memory/disk-space.
Maybe only the labels in the functions-section are wrong.
Almost forgot: Changes on the templates do not require any restart, only a page-reload may be required.
Example (click on arrow for details)
...
[memory.metrics_filters]
value = "$service_name_template$.perfdata.memory.value"
...
[memory.functions]
value = "alias(color($metric$, '#1a7dd7'), 'Used (bytes)')"
Thank you for the speedy response on this. I did see this as a possible option but wasn’t sure if it was the correct approach. So thank you for clarifying this as the best fix for my case.
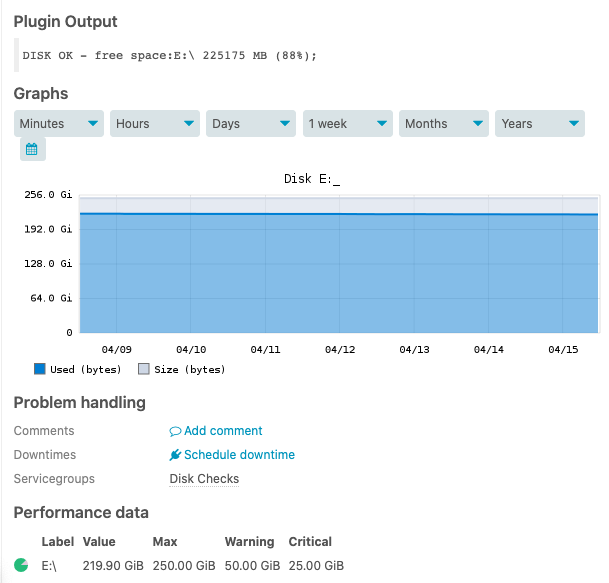
I’ve made the change to the ‘disk’ template which was instant and everything looks fine now for the affected metrics (swap, disk, memory) on our Windows hosts. However I did notice that the Linux disks use this same template file and they report differently, i.e. they output/display ‘used’ instead of ‘free’.
So the linux host graphs are now incorrect, haha. They use different check commands (disk vs disk-windows) but must use the same disk.ini template. Is there an easy fix to ensure both OS are displaying correctly? Thank you in advance.
UPDATE: I created a new template file, so I have one disk.ini for each OS to resolve this issue. Thanks again for the assistance.