Graphite data not showing in Icingaweb2

Greetings!

I’m facing an issue with the Graphite integration into Icinga I can’t get my head around.

First, versions:

  • Running over Debian 9 Stretch
  • Icinga r2.10.5-1 from the Icinga repo
  • Icingaweb2 2.7.1
  • Graphite module version 1.1.0

Graphite-Web is working and I believe the graphite module works OK as I can see the metrics sent from Icinga:

There currently is no authentication nor SSL on the Graphite server.

I have enabled the Graphite module in Icingaweb2. However, all I get is an empty frame:

On my Icinga server, I can see an error 500 in the Apache logs

172.16.0.2 - - [07/Sep/2019:22:55:49 +0200] “GET /icingaweb2/graphite/graph/service?host.name=Rivendell.srv.XXX&service.name=Users&service.check_command=d_linux_users&perfdata=users&default_template=default-service&start=-3600&end=&width=1900&height=220&cachebuster=102753222558013&legend=1 HTTP/1.1” 500 20030 “https://heimdall.srv.XXX/icingaweb2/monitoring/service/show?host=Rivendell.srv.XXX&service=Users” “Mozilla/5.0 (Windows NT 10.0; Win64; x64; rv:69.0) Gecko/20100101 Firefox/69.0”

(As you probably guessed, Heimdall is the name of the Icinga server)

Had a read through the module docs and the GitHub issues but could not find anything that relates.
Does it ring a bell with anyone? I suspect something stupid like a missing PHP module…

I always try three things, when I have this problem:

  1. Refreshing the page with a cache reload (e.g shift+refresh or ctrl+shift+r (for FF))
  2. log out and log in to icingaweb2 again
  3. set the encoding of the ido db resource in icingaweb2 to “latin1” (I’m not sure why this helps, though…:man_shrugging:)
1 Like

There are a couple different graphite modules, the official one and a third-party one that predated it. Can you verify where you got and installed this from?

1 Like

1 and 2 did not help.
For 3, can you clarify which resource? The one used by Icinga core or the one used by Icingaweb2? Thanks!

I did get the module from the Icinga github:


I got tag 1.1.0 from there.

Setting the charset of the Icinga core IDO resource to latin1 partially solved the issue.
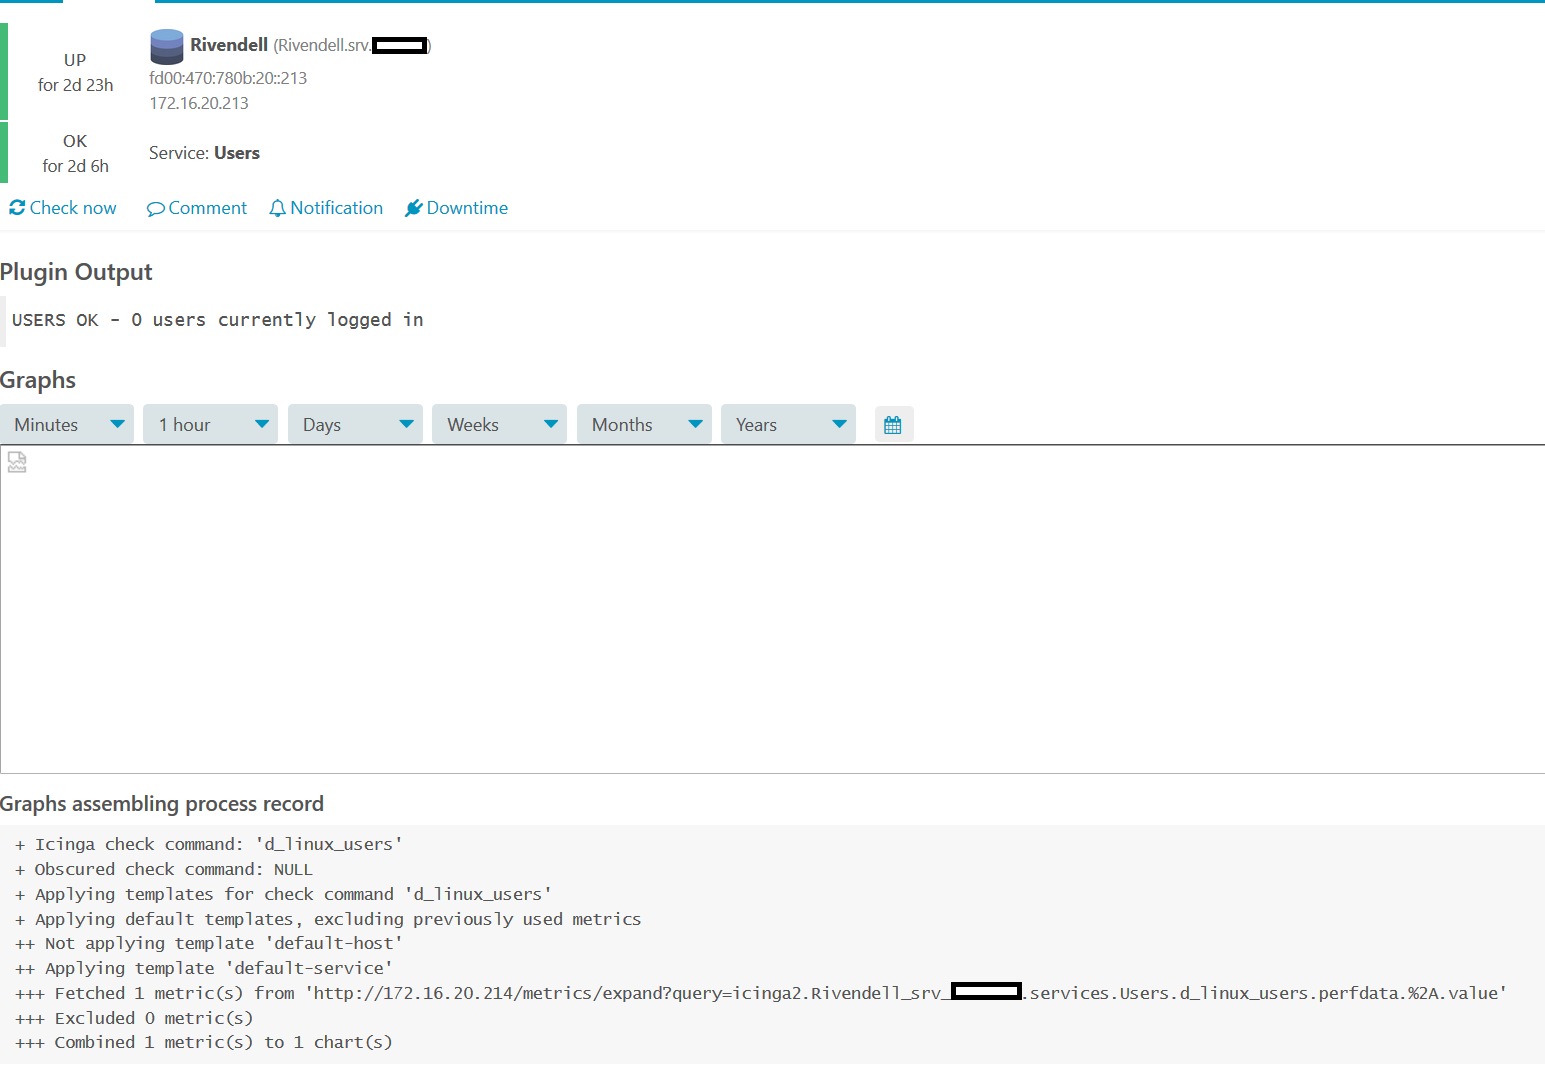
Now under the Graphite page I have all graphs, as well as on the services details. On the host details page the graph zone has disappeared entirely.

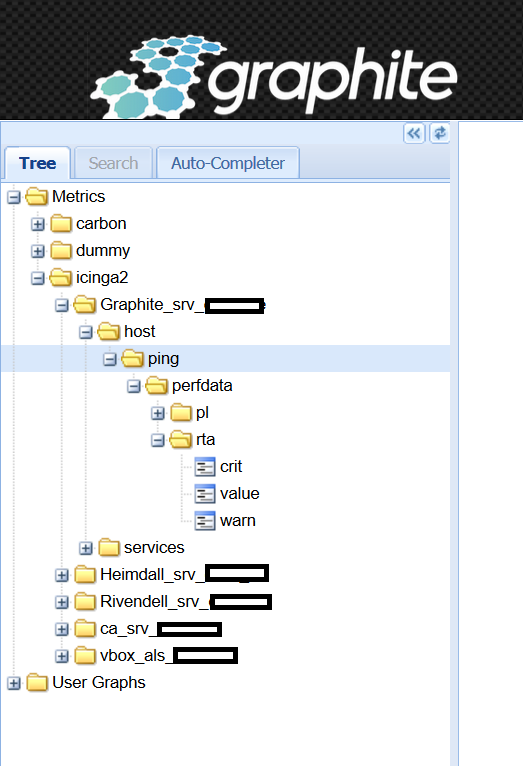
How many hosts do you have? Graphite likes to lose metrics sometimes depending on how it’s configured. If you can find the associated .wsp file or an entry in Graphite’s own web portal for a host not displaying a graph in Icinga, something weird is going on.

Never realized it could bug out based on character encoding in IDO, that’s interesting.

I also never understood why this has any effect, to be honest.

Just on the host detail pages? Or on the service detail pages as well?

Only on the host details page. On service they are there.
At the moment this is a very small setup (4 hosts).

Are you using the ICMP command for checking the hosts? If so, you will have to copy and edit the default ICMP template, that is only for services.

I had this posted somewhere here and as a PR on GitHub

Sorry for the late reply. Switched to the hostalive command and now it works.
I’ll have a look at your PR the templates seem interesting :slight_smile:

see here…