Graphite CPU graphs data not correct

Hello, I’m currently facing a problem with graphite and my CPU load graphs.

My currently storage-schema.conf is this:

[carbon]
pattern = ^carbon\.
retentions = 10s:6h,1m:90d

[icinga2_default]
# intervals like PNP4Nagios uses them per default
pattern = ^icinga2\.
retentions = 1m:2d,5m:10d,30m:90d,360m:4y

So the problem is that when I set this on icinga web

So far so good… But if I choose 4 days I get

The weird thing is that this only happens with CPU checks, If I go to another service (in this case a http response timeI get the right values:

Any ideas what would be wrong on my setup?

Hi and welcome.

This is really weird.

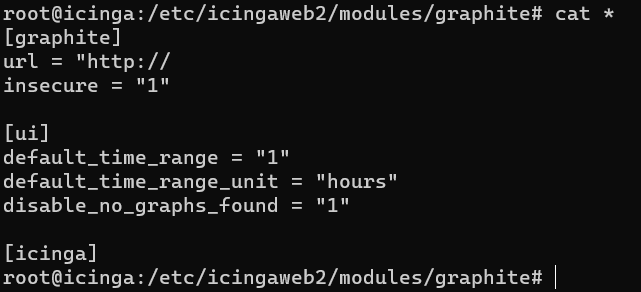
One idea is, that you have a graph setting within the icingaweb2 templates directory (/etc/icingaweb2/modules/graphite/templates/ (default-path)) which affects especially this graph.

Greetings.

Actually no. On that folder I only have the config.ini
image

But can I create a specfic graphsetting for that graph? maybe forcing another retention dunno

Hi again.

Here is a an example.

Filename e.g.: load.ini

[load.graph]
check_command = "load"

[load.metrics_filters]
load15.value = "$service_name_template$.perfdata.load15.value"
load5.value = "$service_name_template$.perfdata.load5.value"
load1.value = "$service_name_template$.perfdata.load1.value"

[load.urlparams]
areaAlpha = "0.5"
min = "0"
yUnitSystem = "none"
lineWidth = "2"

[load.functions]
load15.value = "alias(color($metric$, '#ff5566'), 'Load 15')"
load5.value = "alias(color($metric$, '#ffaa44'), 'Load 5')"
load1.value = "alias(color($metric$, '#44bb77'), 'Load 1')"


[load-windows.graph]
check_command = "load-windows"

[load-windows.metrics_filters]
value = "$service_name_template$.perfdata.load.value"

[load-windows.urlparams]
areaAlpha = "0.5"
areaMode = "all"
lineWidth = "2"
min = "0"
yUnitSystem = "none"

[load-windows.functions]
value = "alias(color($metric$, '#1a7dd7'), 'Load (%)')"

But I guess this is going to the wrong direction, if you do not already have specific settings.

Greetings.

It’s a long time since I used Carbon and Graphite but is the graph ok in Graphite?
Maybe the cpu files for this retention got corrupted - try to export the datapoints on the cli.

1 Like

Don’t think so because I’ve even created a new service with the same check command on a host and the result is the same.

Thinking isn’t good enough :wink:

Please try to verify.

If I troubleshoot something, I try to divide the problem space roughly in the middle and device checks to figure out which half is OK and which isn’t. If you repeat this, the problem space gets smaller and smaller until the bug/error can’t hide any longer.

If I remember correctly carbon files can be stuck in a bad configuration and need to be rebuild for new retention to take effect.

Host A

Host B:
-ServiceName: CPU


-ServiceName: HDD

As you can see it only happens on CPU checks on both devices.

You still watch the problem trough the whole stack and only learned, that it isn’t host but service dependent. Can you try to dissect the stack by having a look directly in Graphite?
If the problem exists there as well, we know it isn’t the icingaweb2 graphite module.
Then it still can be the writer or the carbon db.

Dominik you’re right in what you say,
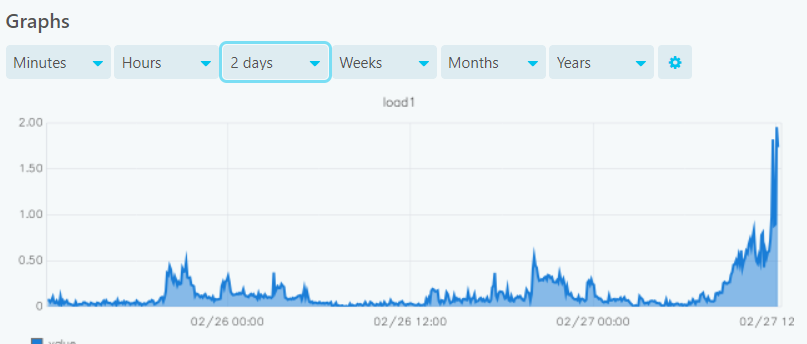
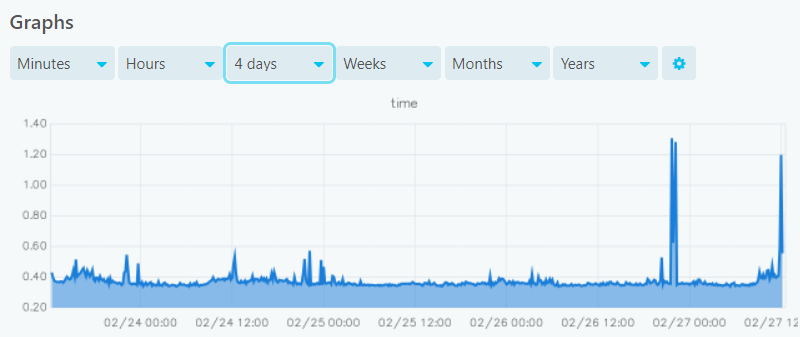
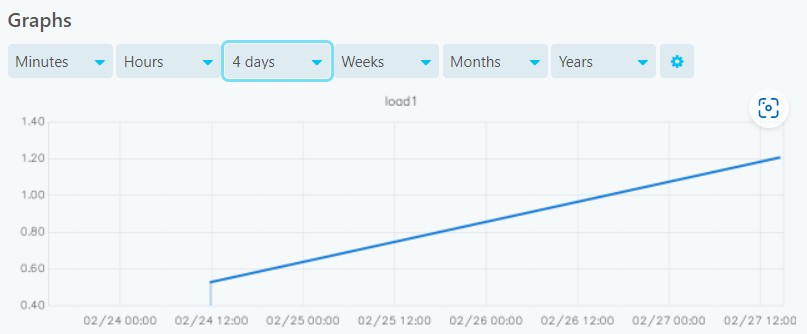
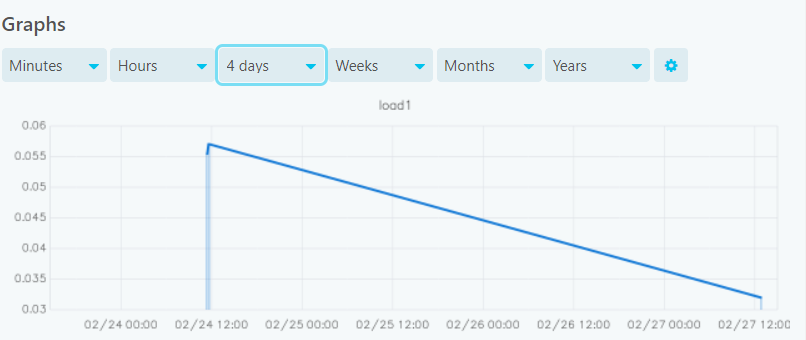
If I go to graphite-web i can see only data for the last 2 days. Nothing before gets saved.
But all my services are configured equally and only this one doesn’t work correctly dunno why :frowning:

Recheck the configuration and then there was a command to apply/reapply the retention config to the carbon files. I guess, you have enough free space and inodes?

Also look it there are carbon logfiles with errors or maybe it logs into syslog.

1 Like

What is the check interval of the cpu check?
It looks like the check is not executed regularly.

Please share the check definition of the cpu check and a correctly working check.

1 Like

Here it goes

Executed Command

‘/usr/lib/nagios/plugins/check_nrpe’ ‘-2’ ‘-H’ ‘10.1.1.8’ ‘-c’ ‘check_cpu’ ‘-p’ ‘56667’

Execution Details

check_source “icinga”
execution_end 2023-02-28T09:06:09.081+00:00
execution_start 2023-02-28T09:06:08.861+00:00
exit_status 0
performance_data [ “load1=0.469;0.750;0.850;0;”, “load5=0.355;0.750;0.850;0;”, “load15=0.283;0.750;0.850;0;” ]
previous_hard_state 2
schedule_end 2023-02-28T09:06:09.081+00:00
schedule_start 2023-02-28T09:06:08.860+00:00
scheduling_source “icinga”
state ok
ttl 0.00 s
vars_after { “attempt”: 1, “reachable”: true, “state”: 0, “state_type”: 1 }
vars_before { “attempt”: 1, “reachable”: true, “state”: 0, “state_type”: 1 }

Object Attributes

acknowledgement 0
acknowledgement_expiry n. a.
acknowledgement_last_change n. a.
action_url n. a.
check_attempt 1
check_command “nrpe”
check_interval 5.00 m
check_period n. a.
check_timeout n. a.
command_endpoint n. a.
downtime_depth 0
enable_active_checks true
enable_event_handler true
enable_flapping false
enable_notifications false
enable_passive_checks true
enable_perfdata true
event_command n. a.
executions n. a.
flapping false
flapping_current 0
flapping_ignore_states n. a.
flapping_last_change n. a.
flapping_threshold 0
flapping_threshold_high 30
flapping_threshold_low 25
force_next_check false
force_next_notification false
groups n. a.
handled false
icon_image n. a.
icon_image_alt n. a.
last_check 2023-02-28T09:06:09.081+00:00
last_hard_state ok
last_hard_state_change 2023-02-27T16:08:37.310+00:00
last_reachable true
last_state ok
last_state_change 2023-02-27T16:08:37.310+00:00
last_state_critical 2023-02-27T16:03:41.410+00:00
last_state_ok 2023-02-28T09:06:09.081+00:00
last_state_type 1
last_state_unknown n. a.
last_state_unreachable n. a.
last_state_warning 2023-02-27T15:33:46.439+00:00
max_check_attempts 5
next_check 2023-02-28T09:11:08.860+00:00
next_update 2023-02-28T09:16:09.302+00:00
notes n. a.
notes_url n. a.
original_attributes { “enable_notifications”: true }
previous_state_change 2023-02-27T16:08:37.310+00:00
problem false
retry_interval 5.00 s
severity 0
state ok
state_type 1
vars { “TipoAlerta”: “Grave”, “nrpe_command”: “check_cpu”, “nrpe_port”: “56667”, “nrpe_version_2”: true }
volatile false
zone “icinga”

Custom Variables

TipoAlerta Grave
nrpe_command check_cpu
nrpe_port 56667
nrpe_version_2 1

Volatile State Details

check_attempt 1
check_commandline “‘/usr/lib/nagios/plugins/check_nrpe’ ‘-2’ ‘-H’ ‘10.1.1.8’ ‘-c’ ‘check_cpu’ ‘-p’ ‘56667’”
check_source “icinga”
check_timeout 5.00 m
execution_time 220.00 ms
hard_state ok
host_id “0b85f3c8dd5bbc0eb676c632e7c70f7588f09203”
in_downtime false
is_acknowledged 0
is_active true
is_flapping false
is_handled false
is_problem false
is_reachable true
last_state_change 2023-02-27T16:08:37.310+00:00
last_update 2023-02-28T09:06:09.081+00:00
latency 1.00 ms
next_check 2023-02-28T09:11:08.860+00:00
next_update 2023-02-28T09:16:09.302+00:00
normalized_performance_data “load1=0.469000;0.750000;0.850000;0 load5=0.355000;0.750000;0.850000;0 load15=0.283000;0.750000;0.850000;0”
output “OK - load average per CPU: 0.47, 0.36, 0.28”
performance_data “load1=0.469;0.750;0.850;0; load5=0.355;0.750;0.850;0; load15=0.283;0.750;0.850;0;”
previous_hard_state critical
previous_soft_state critical
scheduling_source “icinga”
service_id “21c4ccb24ebde6a674b3cffbee188e5ebea6ea60”
severity 0
soft_state 0
state_type 1

Hi again.

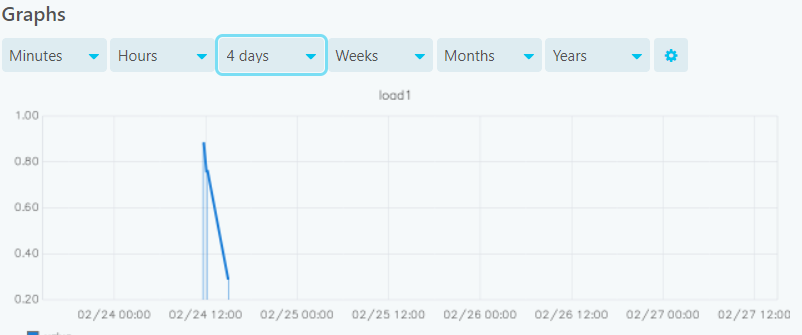
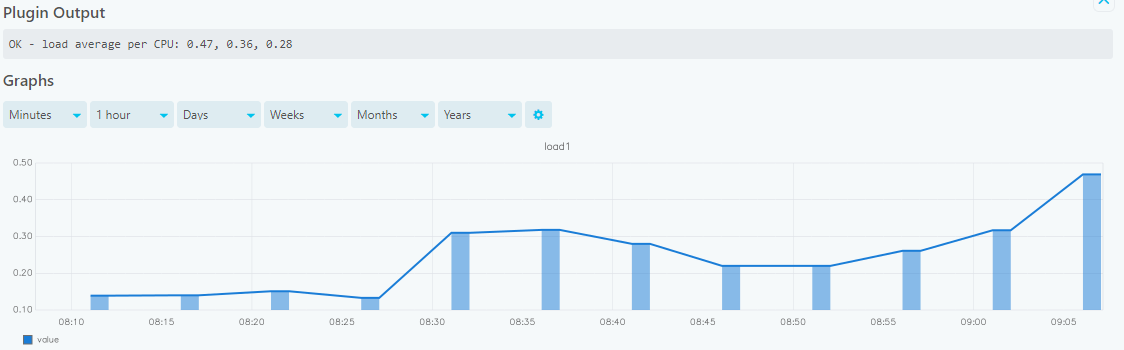
So your check interval is 5 minutes.
This might not be enough, depending on the xFilesFactor, for checks to get stored longer than 2 days.
Please see here: Funky link

Greetings.

2 Likes

good point!
check your storage-aggregation.conf for that setting.

here is another explanation:

be aware that changes to both files (storage-schemas and storage-aggregation) only take effect on new archives, unless you do a whisper-resize on the exisiting ones.

2 Likes

So here’s my storage-aggregation:

[min]
pattern = .lower$
xFilesFactor = 0.1
aggregationMethod = min

[max]
pattern = .upper(_\d+)?$
xFilesFactor = 0.1
aggregationMethod = max

[sum]
pattern = .sum$
xFilesFactor = 0
aggregationMethod = sum

[count]
pattern = .count$
xFilesFactor = 0
aggregationMethod = sum

[count_legacy]
pattern = ^stats_counts.*
xFilesFactor = 0
aggregationMethod = sum

[default_average]
pattern = .*
xFilesFactor = 0.3
aggregationMethod = average

If I understand corretly I have two options:

Define something like this on storage-schemas.conf

[icinga_5m]
pattern = ^icinga2..*.SERVICE-NAME
retentions = 5m:10d,30m:90d,360m:4y

Or alter my storage-aggregation.conf setting this:

[default_average]
pattern = .*
xFilesFactor = 0.2
aggregationMethod = average

Am I right?

pattern = ^icinga2\..*\.SERVICE-NAME ?

Dominik, create a pattern to change the retention only for this service and not all the services.

Setting a new definition for it.

It’s a valid strategy but needs work for every service that changes from 1min to 5min or even sparser execution.

My comment above I just wanted to hint at the difference between . (any char) and \. (a literal .).

So, I’m lazy and would first try to change the storage-aggregation.conf.