Hey,
I’ve come across a really strange behaviour when trying to setup Grafana Graphs with InfluxDB. Some of my Graphs are shopwing up in Icinga as they should, but when I want to check the same in graph in Grafana itself (http://localhost:3000), the graphs show no data points. But some of them do in Icinga2 itself.
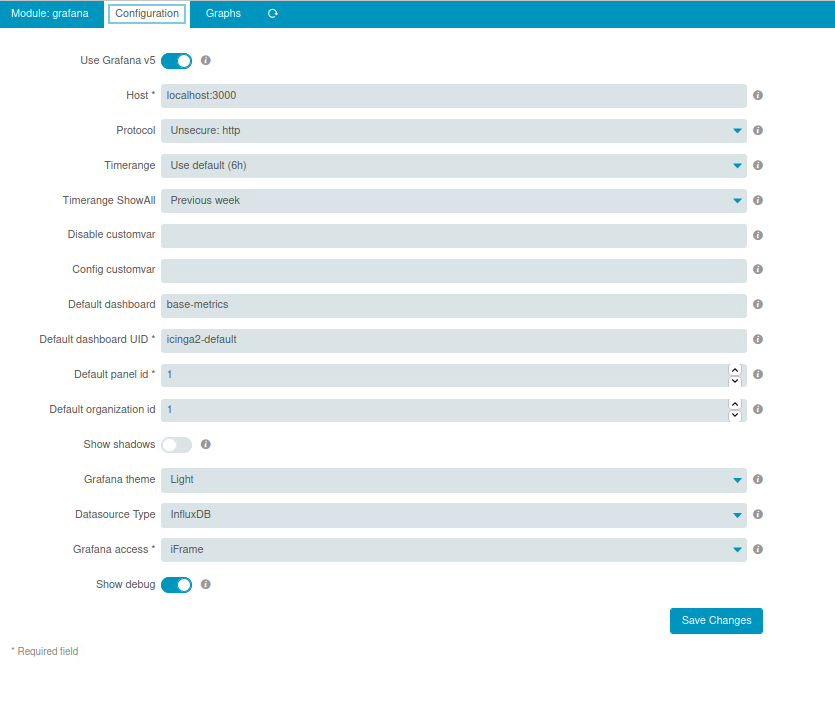
I’ve importet the dashboard “base-metrics” and configured my settings as followed:
Icinga2:
Grafana Data-Source:
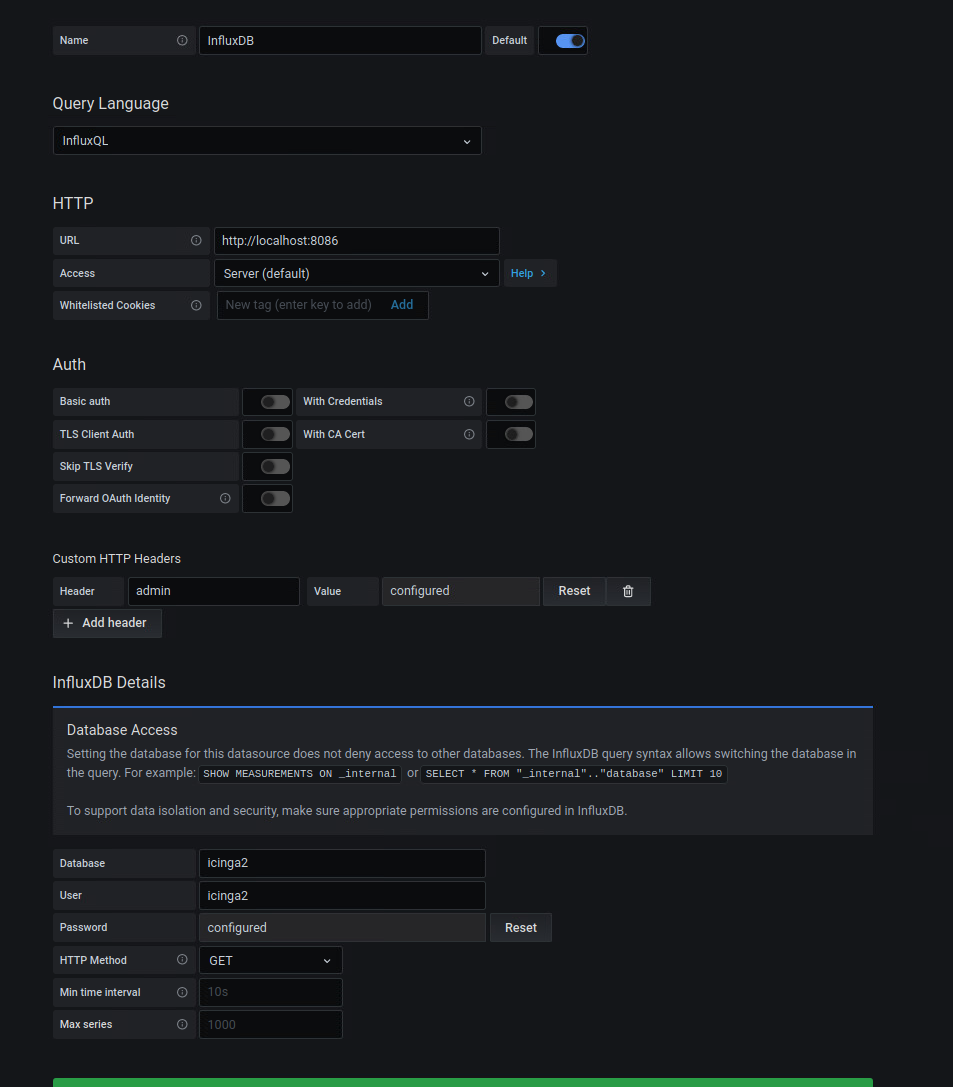
When showing measurements in InfluxDB, I get the right services and can query data.
Anyone having an idea?
EDIT: Normally when using “base-metrics”, you can choose between the hosts and services you currently have, as they are being custom variables. I’m not able to do that, so maybe it doesn’t sync right? But why?
Best regards