Using this dashboard as icinga2-default looks like this
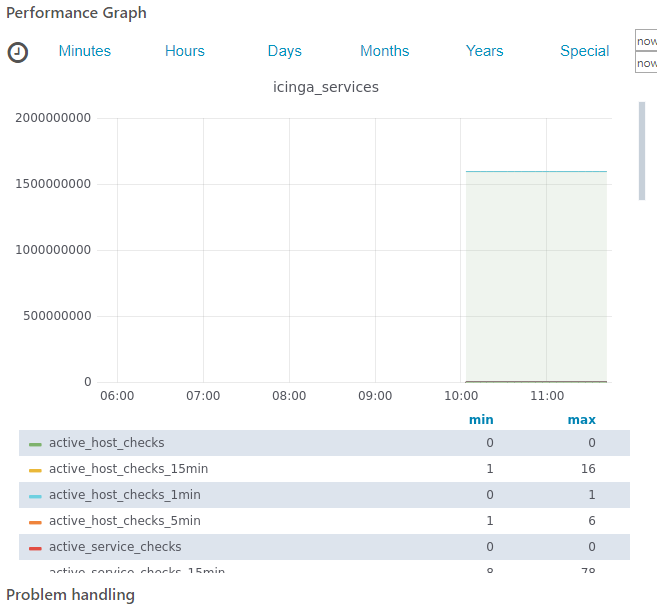
I already changed Graph height to 500 but still cannot see the whole legend. And the scroll bar is not accessible. Changing Graph height to 1000 displays everything but looks ugly (and is not needed for single metrics of course).
Can Graph height be configured dynamically? Or is there any other chance to get better results?