I added a new service and wanted to add a grafana graph but after creating it in Grafana getting the query to work, adding the panel ID in the icinga web Grafana module the graph doesn’t show up in the service.
I recently upgrade Grafana to 7.0.0 but I’m not sure if that’s the issue as all my other graphs are still working. This is the first new graph after the upgrade though. This is just a lab server so I wasn’t too worried about it.
icinga - 1.13.4-2build1
icingaweb2 - 2.8.0~rc1-1.bionic
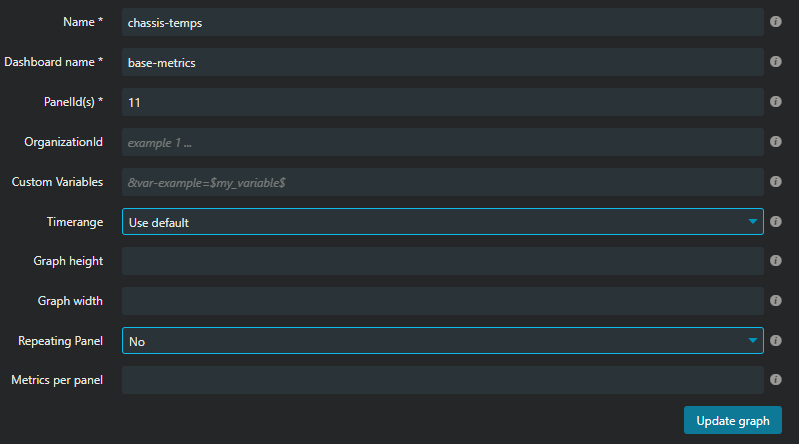
Here’s the grafana module config.
Here’s the grafana link I got the panel ID from
http://192.168.30.22:3000/d/-NN3FaaZk/base-metrics?viewPanel=11&orgId=1&refresh=30s&var-hostname=ASRock IPMI&var-service=check_ipmi_sensor&var-disk=&var-windisk=
I’m still sort of fuzzy how icinga pulls the graph and knows what service it should go to. I can’t find anything I’ve forgotten from doing a few other services a couple weeks ago. I’m not sure where to start troubleshooting other than trying rollback the grafana version.