Hello!
I have the following issue with icingaweb2-module-grafana [This one]
After having configured a Default Dashboard and Panel under “Module Configuration”, I successfully get Graphs for any Host and their corresponding check command.
Unfortunately on the Service View (after clicking on a Service of a Host from the Host View),
where i would also Expect a Graph (even with misconfiguration on the Grafana Dashboard just any Graph), none is being shown.
While any Host View shows a “Performance Graph” Section (with the Correct Graph), the same section is completely missing for any service.
After reading the documentation [here], I am under the assumption, that this is not the expected behaviour.
This is what a Host View looks like on my setup:
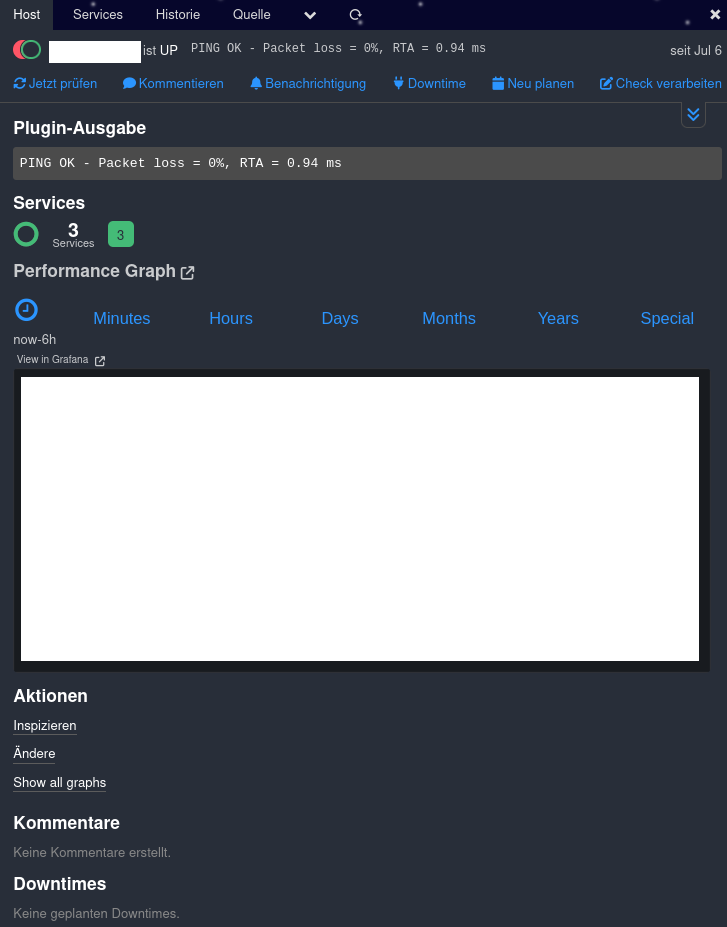
I censored the Graph with a big white rectangle
This is what a Service View looks like on my setup:
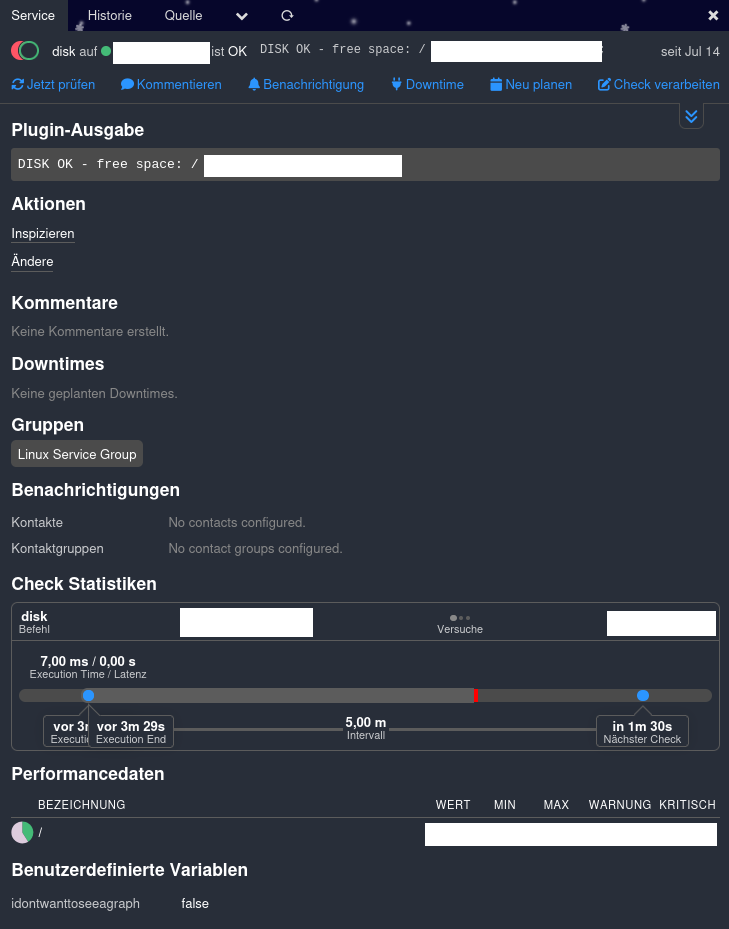
I would expect the “Performance Graph” Section to also appear on the Service View.
I have tried explicitly adding a graph under “Graphs Configuration”, keeping Dashboard Name, UID and Panel ID the same as in “Module Configuration”, since the Grafana-Dashboard takes Variables.
I made sure, that the Name was correct, and was mirroring the name of a Service, that is currently being monitored. I tried this with several Services and i tried to use the check_command as the name instead.
I made sure, that on the Grafana Dashboard there is a corresponding Graph, which should be shown. I made sure that the Connection to Grafana works, by testing it with the Host View.
For the connection the anonymous proxy method is being used with a service account.
As a last resort i have explicitly set idontwanttoseeagraph as a custom field for icinga-director,
and then set it to false for the only host template and service template.
After deployment i have made sure to confirm that ’ vars.idontwanttoseeagraph = “false” ’ exists as a line in both service_templates.conf and host_templates.conf.
It’s also visible on the Bottom of the Second Screenshot.
I did not notest any Errors in the Developer Console on Firefox, when opening the service in the second screenshot.
Am i missing some important step entirely or might this be a bug?
This is my Setup, please tell me if you need anything else:
Icinga Web 2 Version 2.12.4
Git Commit 219b11789beb0484b7993fa9ea838edd211ca5b2
PHP-Version 8.2.28
icinga/icinga-php-thirdparty 0.13.0
icinga/icinga-php-library 0.16.1
director 1.11.5
doc 2.12.4
grafana 3.1.1
icingadb 1.2.0
incubator 0.22.0
setup 2.12.4
Thank you in advance and best regards!