Hi,
We recently upgraded to latest icingaweb version and moved from monitoring to icingadb. Since then we can’t see the grafana charts preview for any host or service, but when we click on the chart (which is not visible) it opens the chart in Grafana and can see it. We used grafana module 1.3.6 before upgrading to 2.0.3. Any idea?
-
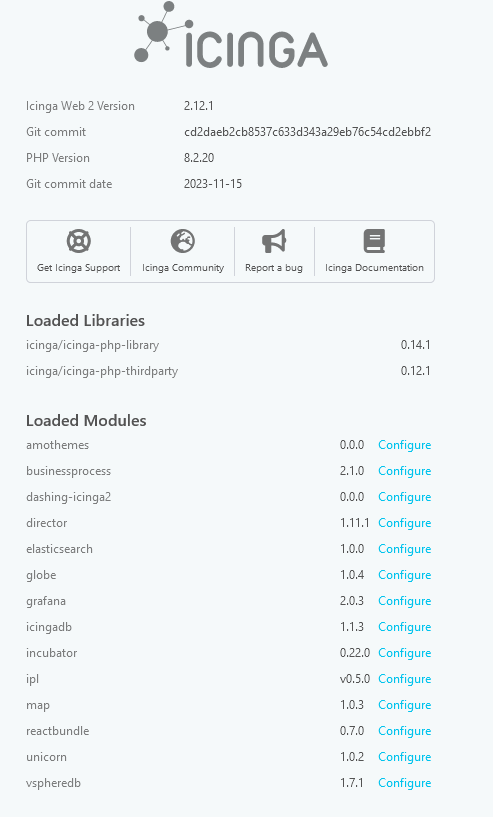
Icinga Web 2 version: 2.12.1
-
Used modules and their versions (System - About)
-
Web browser used: Firefox 115.14.0esr (64-bit)
-
Icinga 2 version used (
icinga2 --version): r2.14.2-1 -
PHP version used (
php --version): 8.2.20 -
Server operating system and version: Debian 12
