Grafana dashboard shows wrong metrics for 30days(CPU shows more than 100%). whereas when I check for 7days CPU gives correct metrics(50%) for the same days. Is there anything wrong in the query.?
Query : aliasByNode(sumSeriesWithWildcards(asPercent(derivative(collectd.mya-d3-prod-02.kafka.*.aggregation.cpu-average.cpu.{user,system,softirq}), 3000), 7), 3)
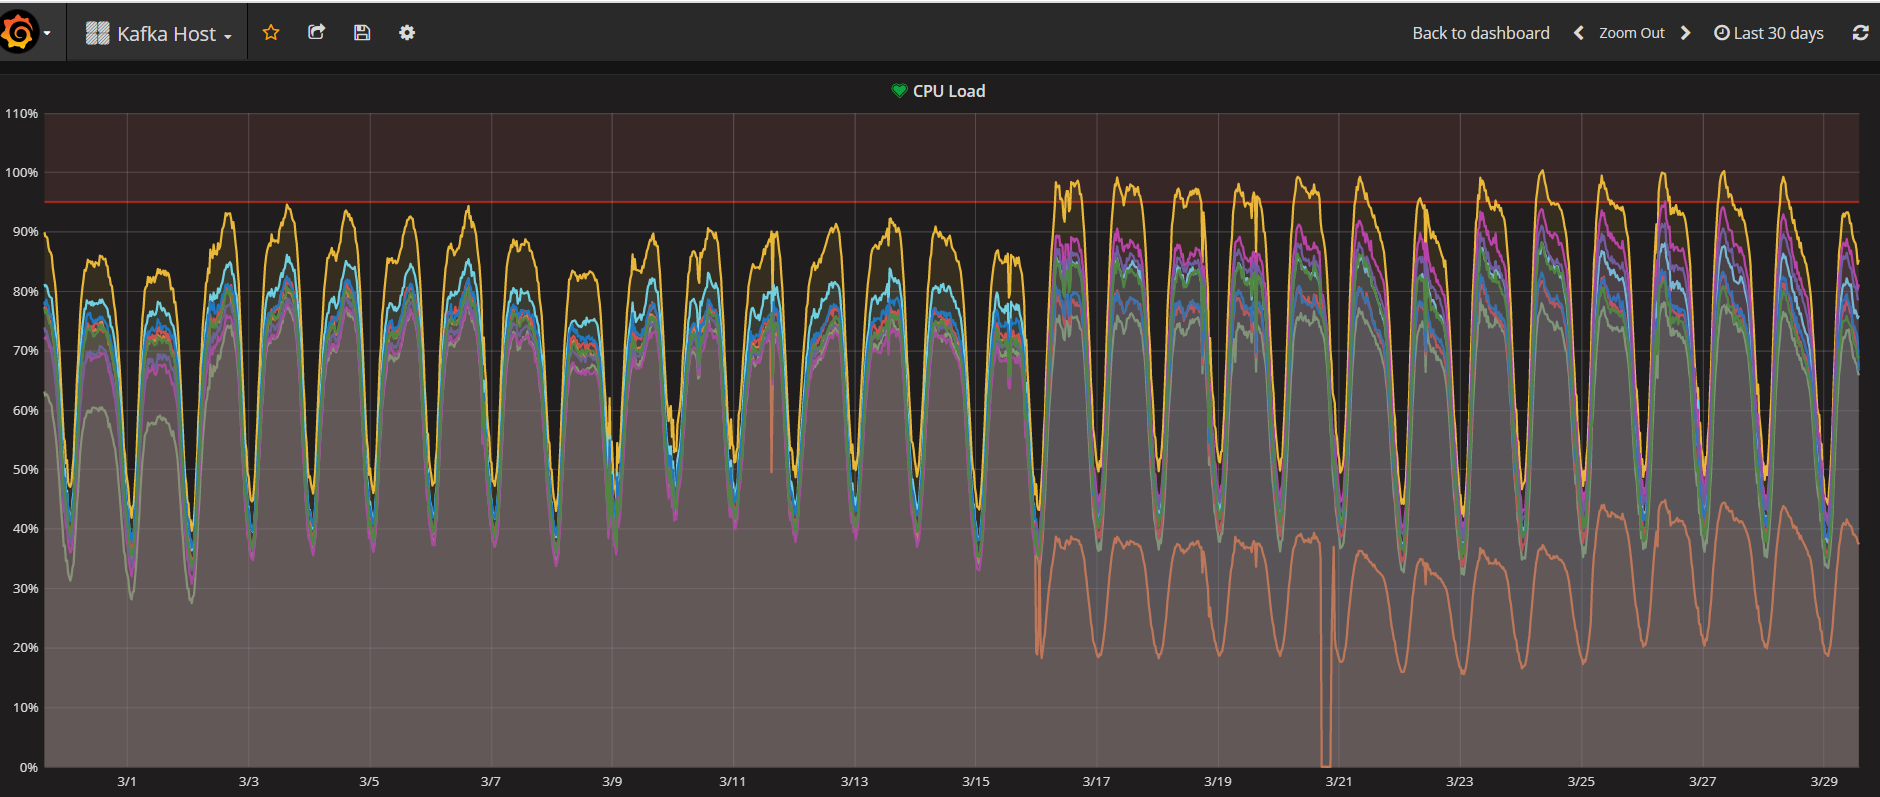
30days metrics:
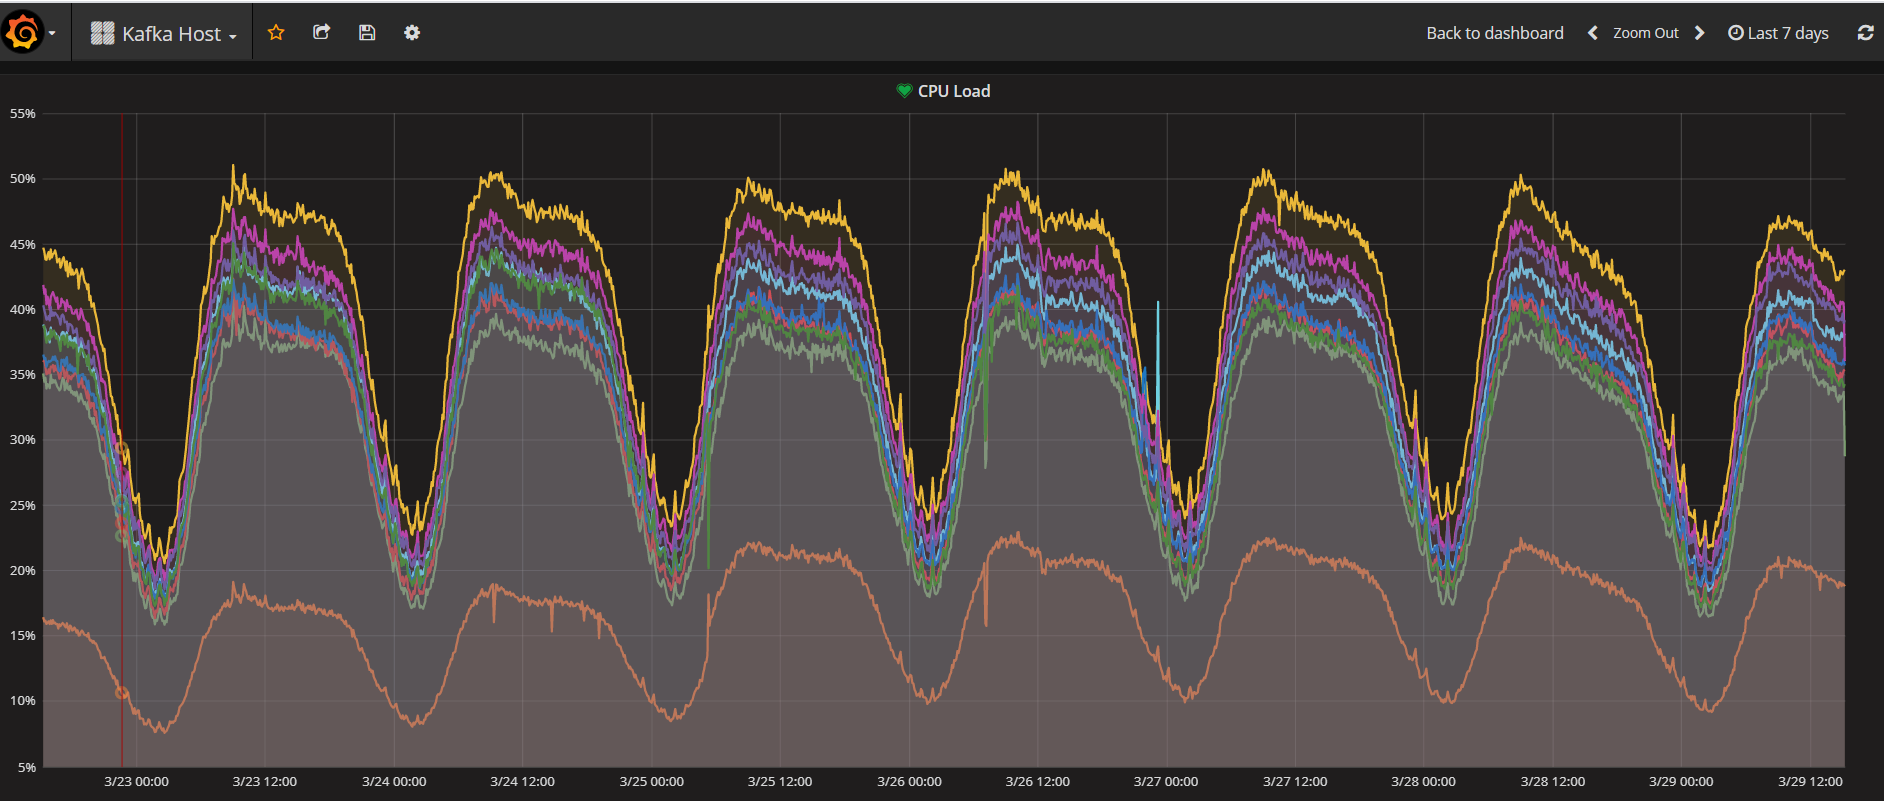
7 days metrics