Grafana integrated graphs -> units

I am creating graphs using grafana and the grafana module. The script outpput looks like this:

./check_isilon -t data_sum -i STORAGE-HOST
Data sum on Isilon STORAGE-HOST: Oracle: 4.59TB, ISP: 41.92TB, Veeam: 207.81TB|‘STORAGE-HOST ORA’=4.59TB;; ‘STORAGE-HOST ISP’=41.92TB;; ‘STORAGE-HOST Veeam’=207.81TB;;

As you see, the unit is TB. The graph, however translates that to Tri and Quadr on the left Y axis:

This is the performance data reported in the web interface:
image

You see, units are mixed. Whats going on here?

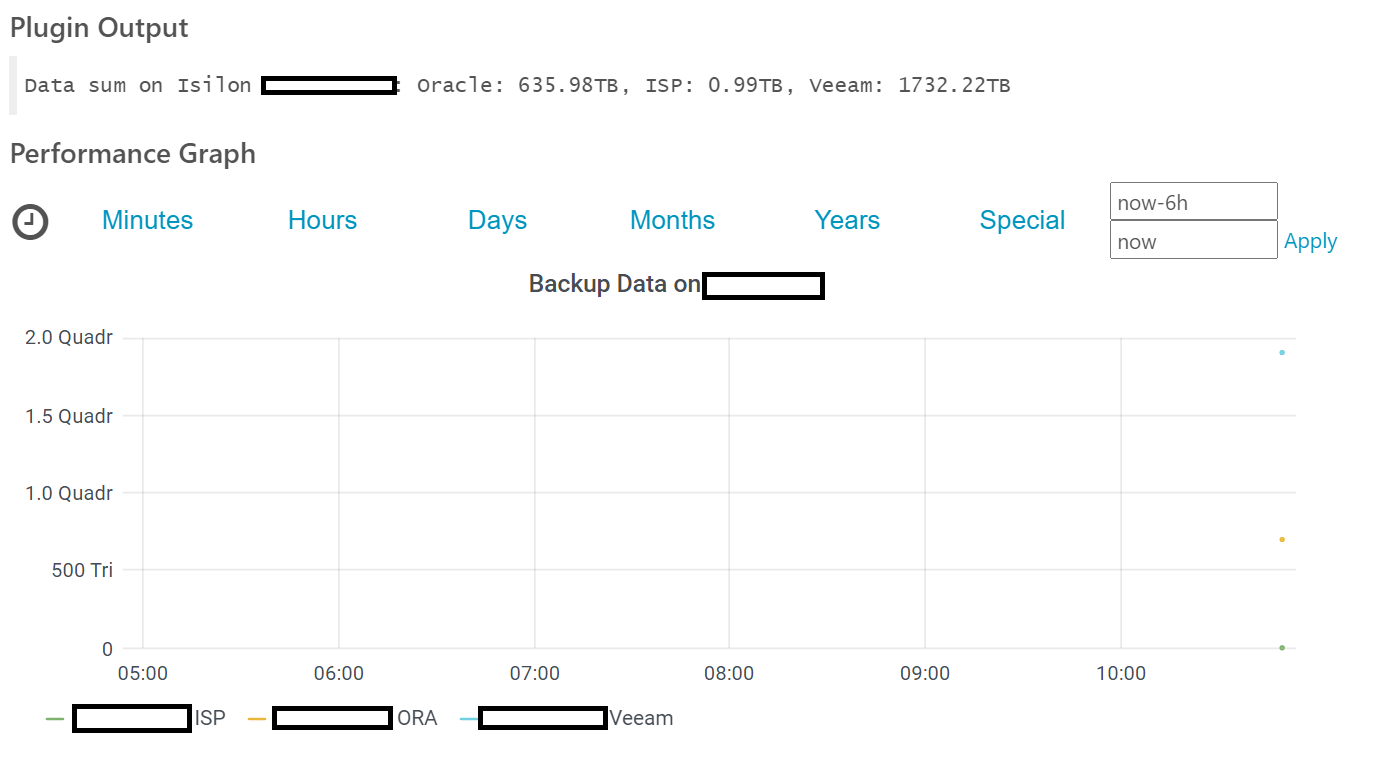
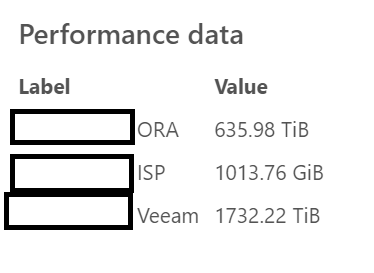
Have you assigned a specific dashboard panel to the check? If no, the default panel has no unit set, if I remember correctly, so it will use normal numbers instead.

When you create your own dashboard or panel in grafana you can choose the unit and should get the result correctly displayed there. Then you can assign the panel to service name or check command in the Grafana module configuration so the module uses this one instead of the default one.

1 Like

Thank you, I will try that. Crap, now I need to learn Grafana…

It will definitely be worth it, I have seen many fancy dashboards with very weird data sources I would not have imagined when using Grafana first and only for monitoring data.