is it possible to define a template in Grafana for IcingaWeb2 that contains an unknown number of drives? Like in a loop? I think I saw that somewhere…
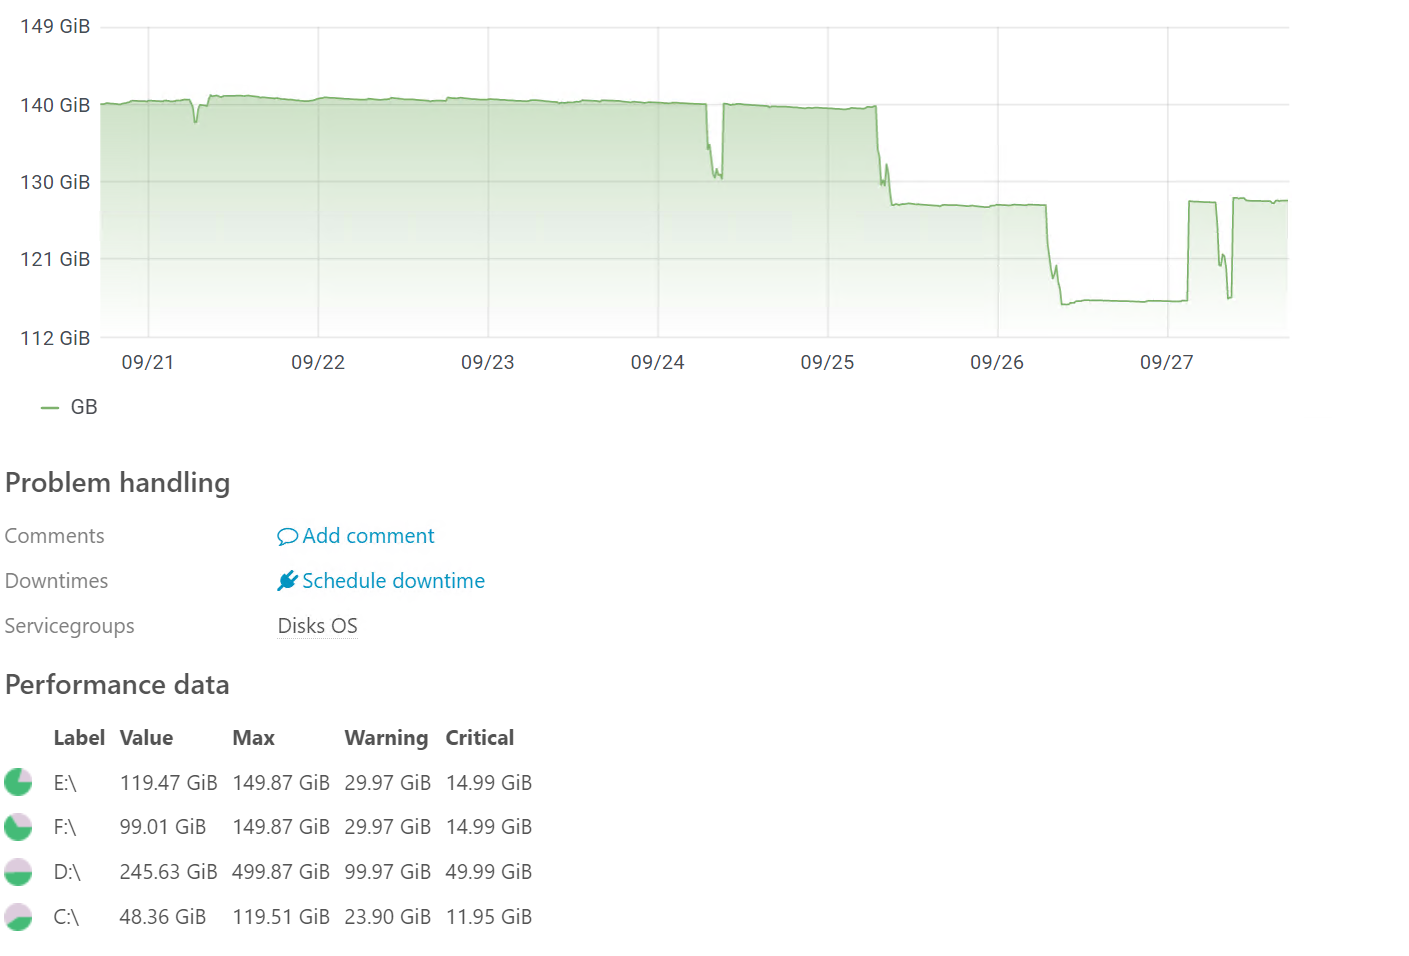
The Graph in IcingaWeb2 has a bad number format, so I want to define a Graph in the base-metrics dashboard. I’m struggling at the part where I create the selection for the data lines. Each Server has a different number of drives, so I cannot just pick drive C: to F:
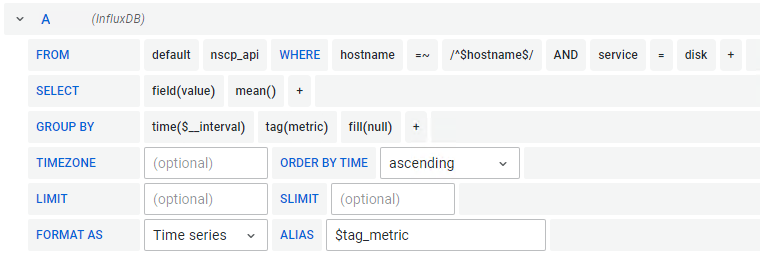
regex works in general, but I’m not able to make it work here…
SELECT mean(“value”) FROM “disk-windows” WHERE (“hostname” =~ /^$hostname$/ AND “service” =~ /^$service$/ AND “metric” = ‘*’) AND $timeFilter GROUP BY time($__interval) fill(linear)
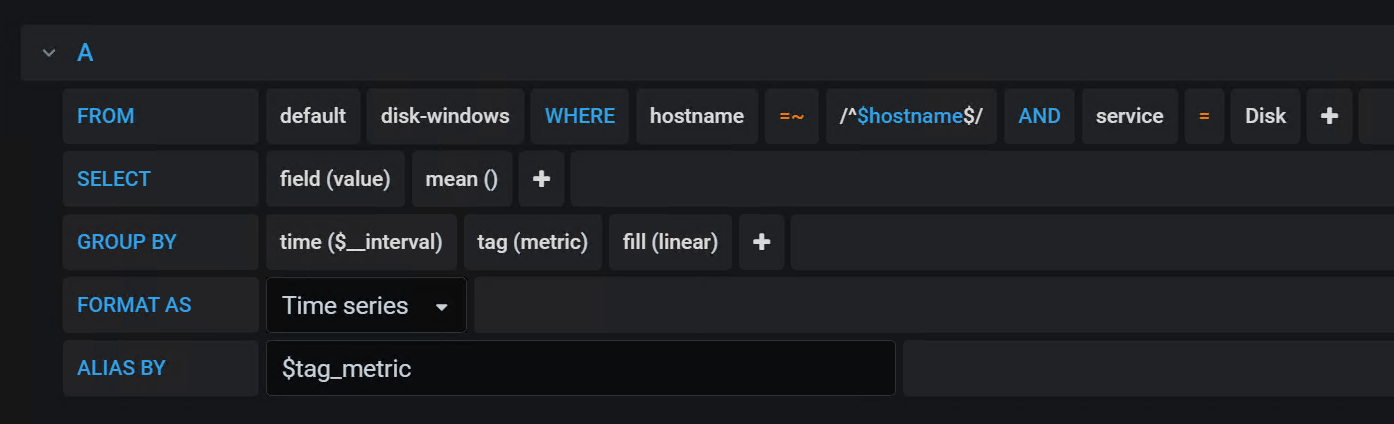
I don’t have an InfluxDB system to test with, but I was thinking something like metric =~ '.*'). From your last example it doesn’t look like you changed the operator to regex.
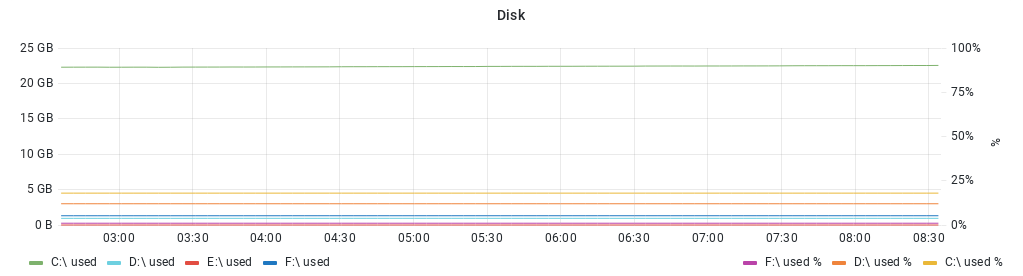
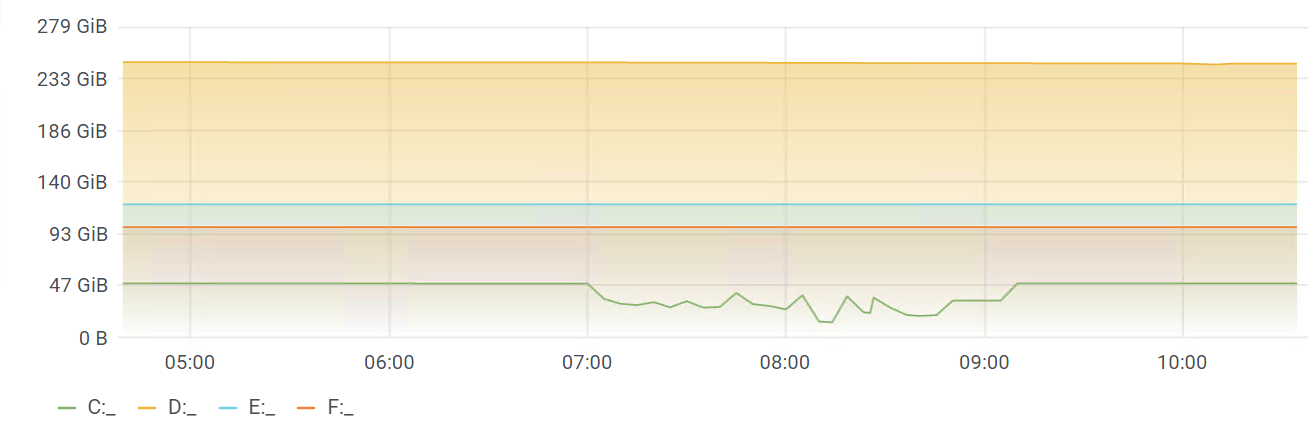
that works somehow, but it does not grenerate a graph per disk. Only one for the first disk (I guess). Attached the Icinga view to show data from different disks
SELECT mean(“value”) FROM “disk-windows” WHERE (“hostname” =~ /^$hostname$/ AND “service” = ‘Disk’ AND “metric” =~ /.*/) AND $timeFilter GROUP BY time($__interval) fill(linear)
It may be worth opening an Issue on Github for the appropriate plugin that’s generating the graph within IcingaWeb2. With regards to Grafana, you may find more expertise in a Grafana or InfluxDB specific forum.