Hi,
Trying to integrate Grafana Graphs into Icingaweb2. Mode is iframe with anonymous access, influxdb and Grafana works (dashboard base-metrics is filled with data).
Within icingaweb2, there is only blank space where the graph should be displayed. Can you please advise?
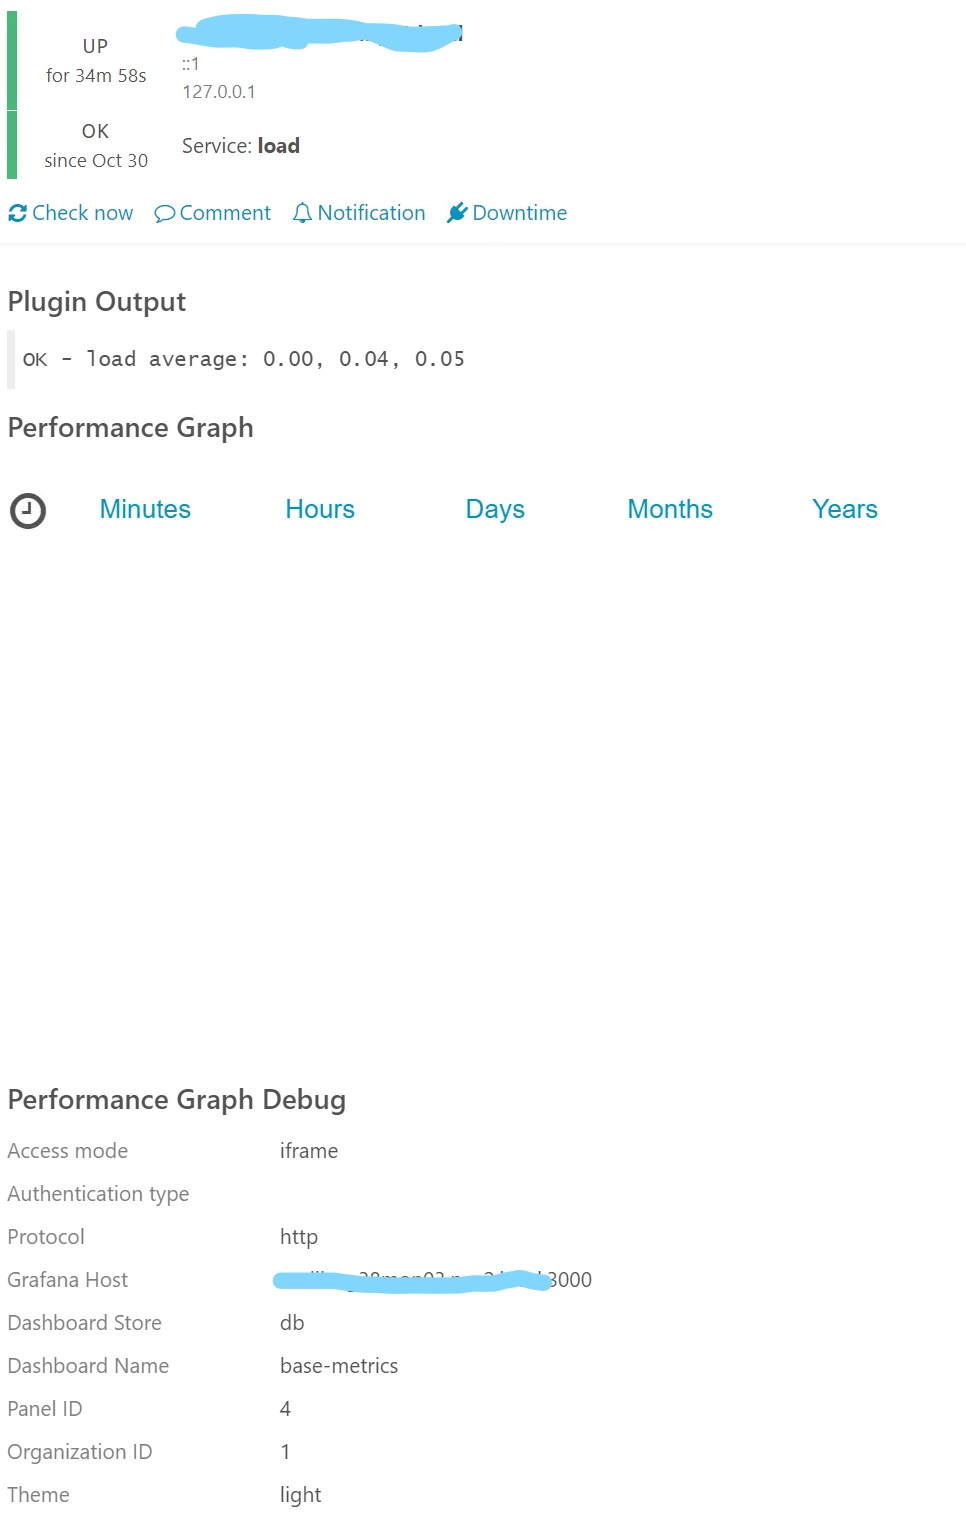
Service integration empty:
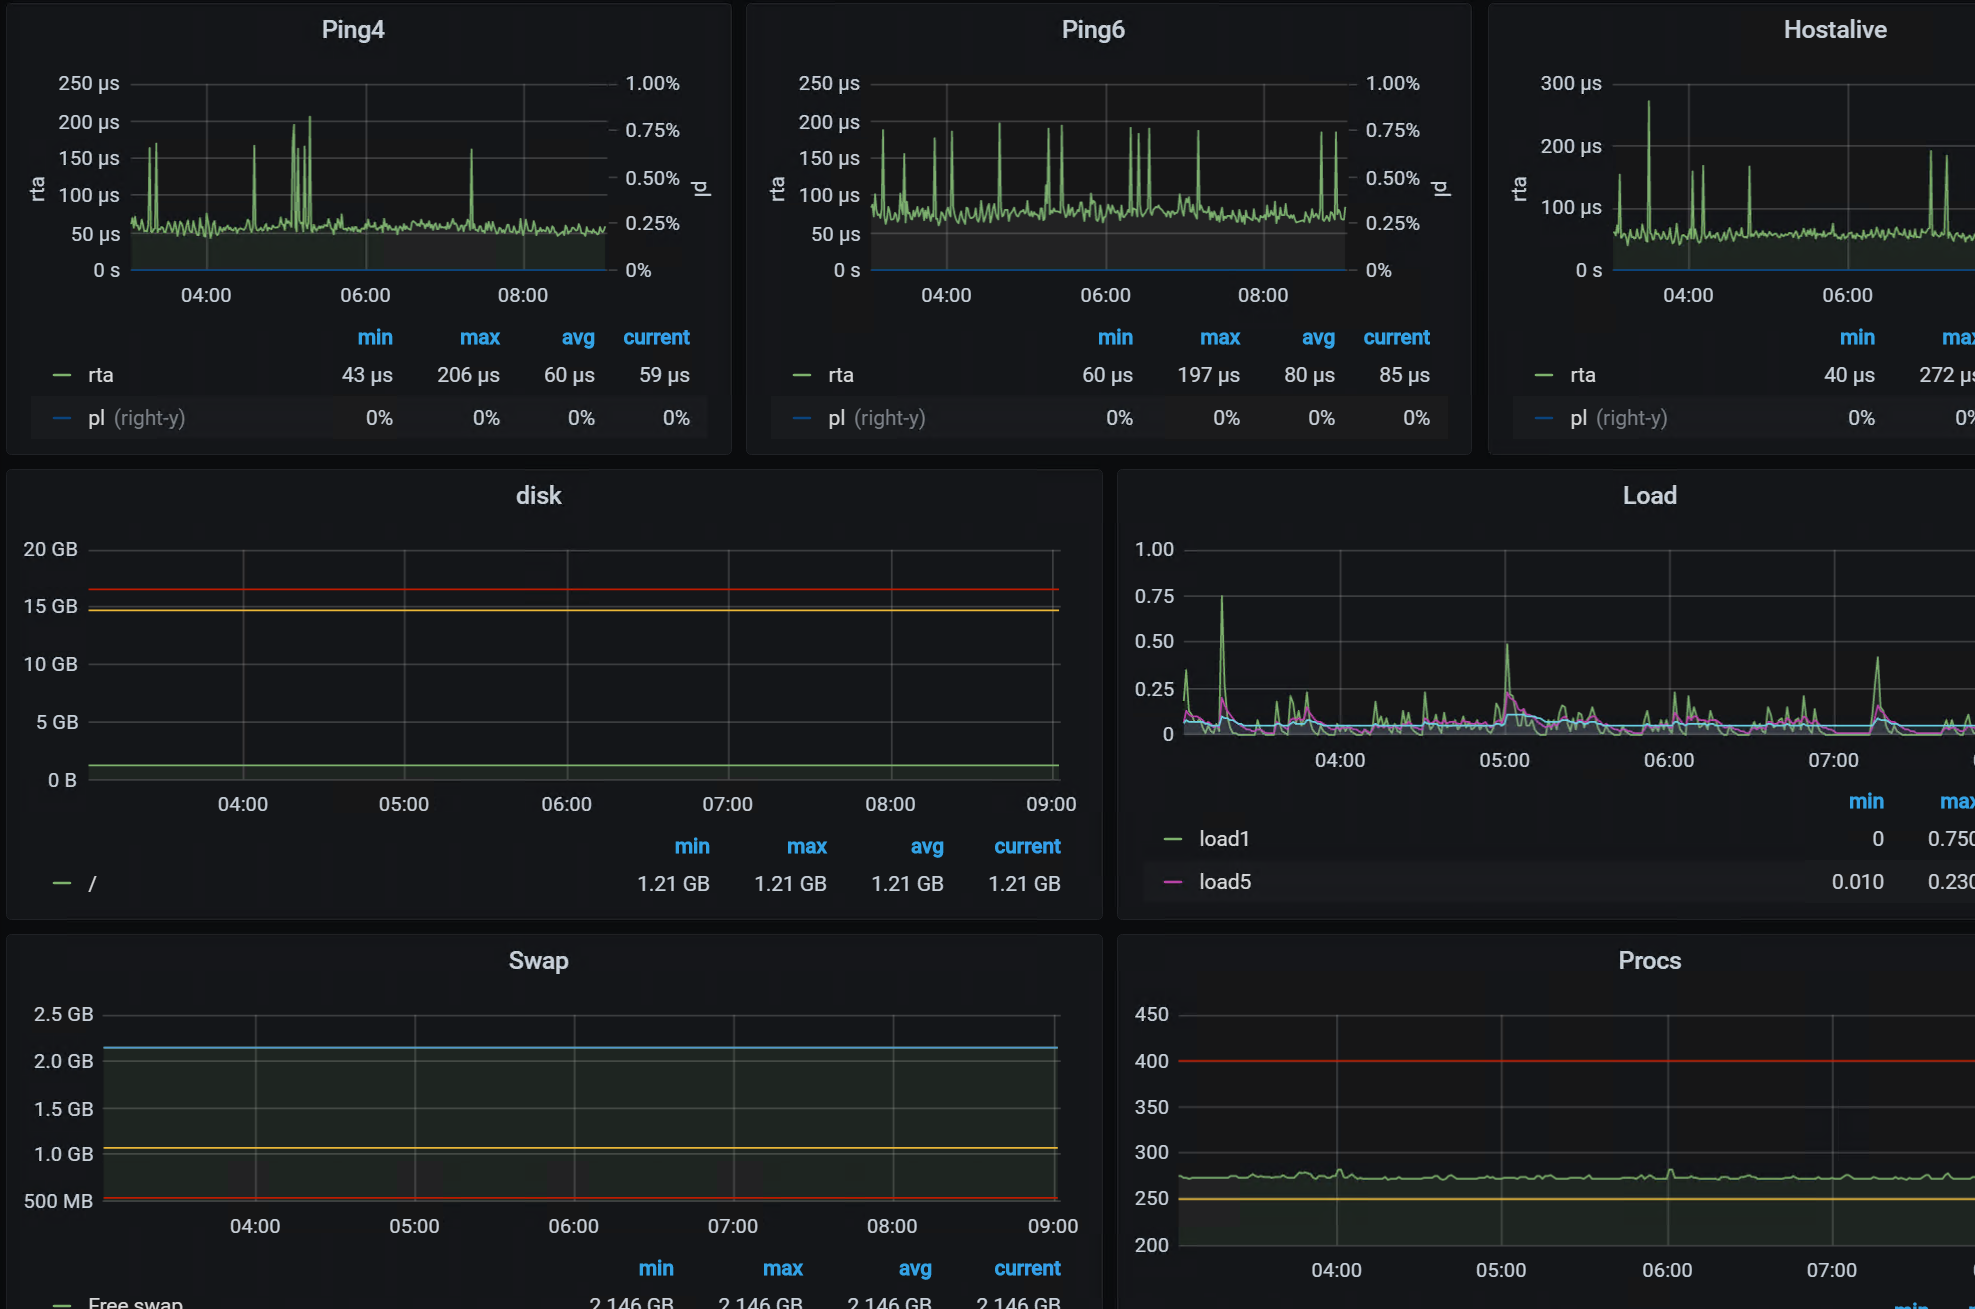
Data is being collected and transfered into influxdb and accessed by Grafana:
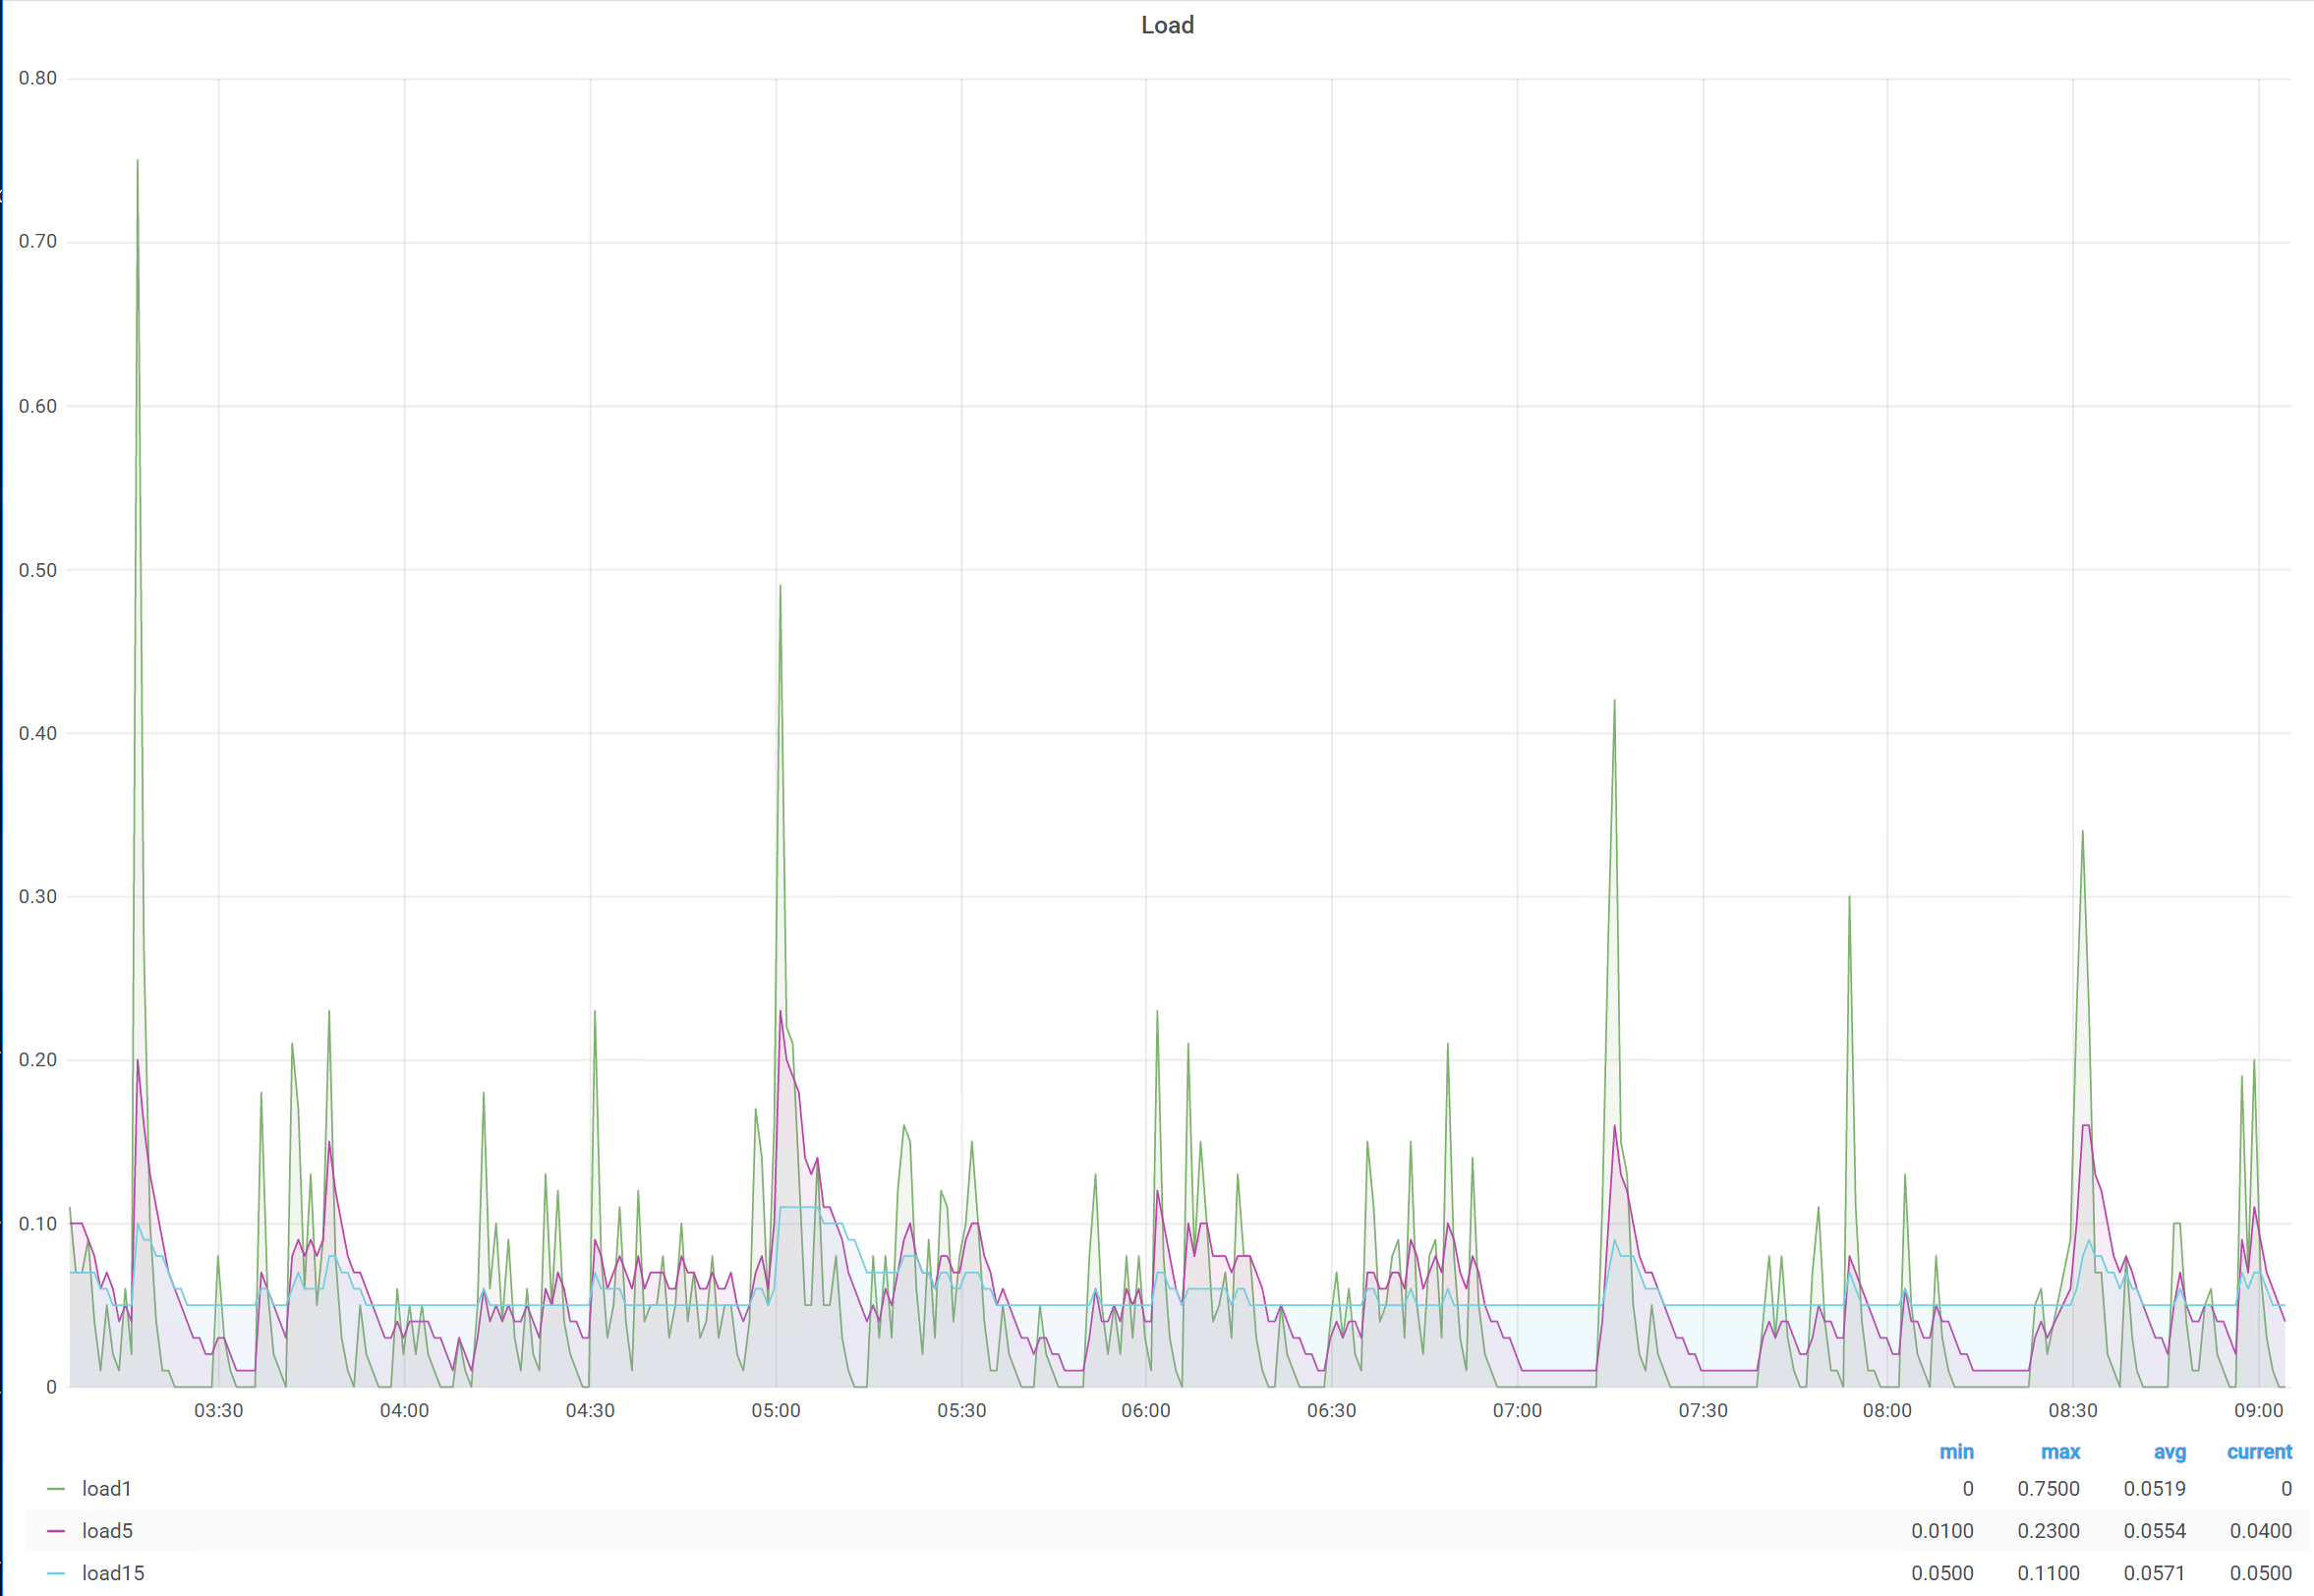
When accessing the Graph directly, using the URL from debug output, everything looks fine:
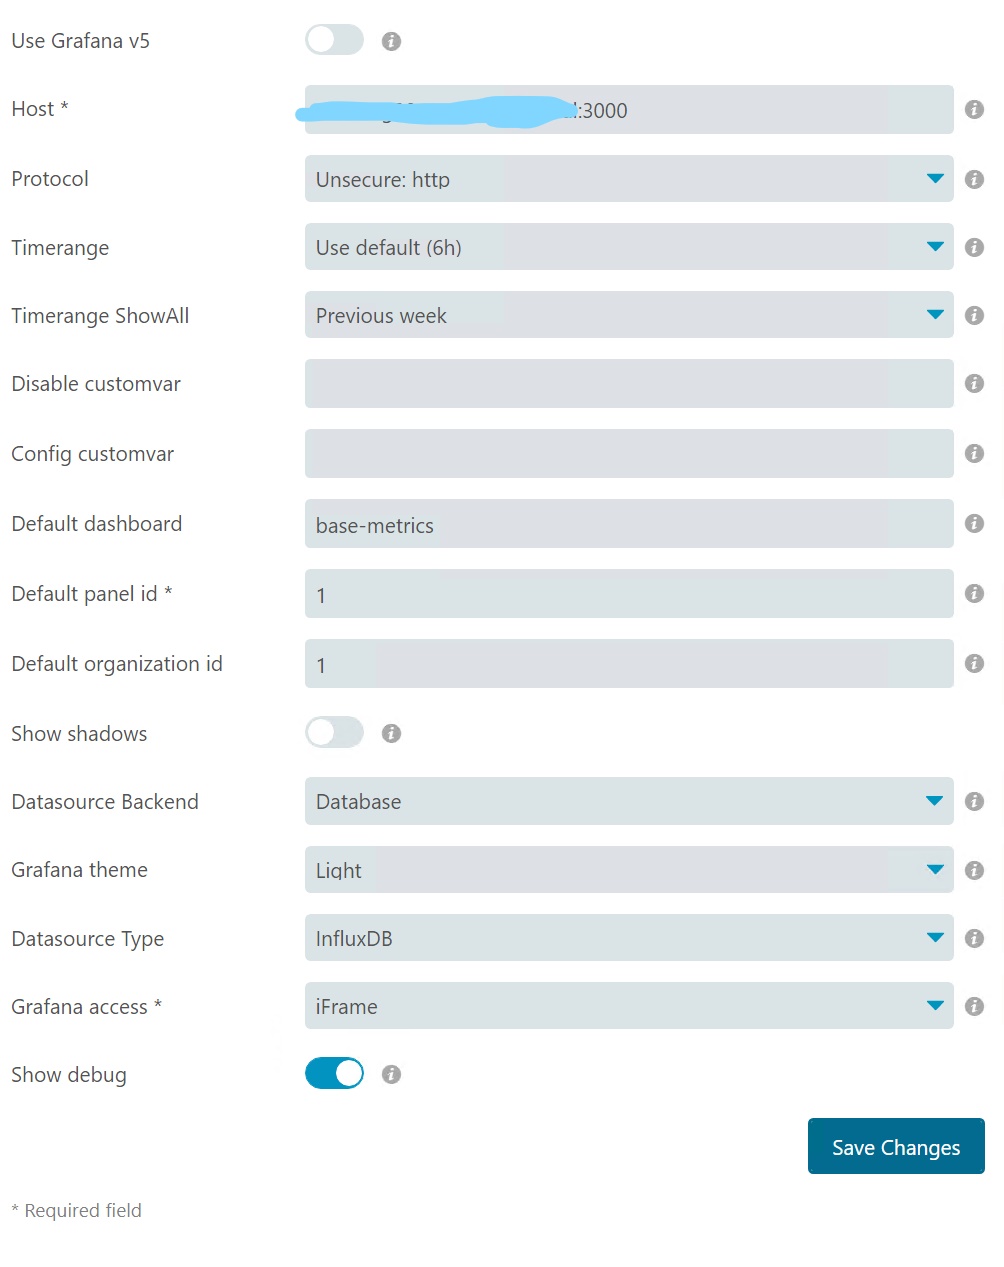
Grafana module setup:
I’m wondering: Organisation Name is used as a poor-mans-authentication. I dont see where I can put the authentication into the module setup…
Okay, update. I got the “indirect proxy” running by solving this issue:
Nov 3 19:53:05 MONITORINGHOST grafana-server: t=2020-11-03T19:53:05+0100 lvl=eror msg=“Render request failed” logger=plugins.backend pluginId=grafana-image-renderer url=“http://localhost:3000/dashboard-solo/db/base-metrics?var-hostname=MONITORINGCLIENT&var-s ervice=ping4&var-command=ping4&panelId=1&orgId=&width=640&height=280&theme=light&from=now-6h&to=now&render=1” error=“Error: Failed to l aunch chrome!\n/var/lib/grafana/plugins/grafana-image-renderer/chrome-linux/chrome: error while loading shared libraries: libXss.so.1: cannot open shared object file: No such file or directory\n\n\nTROUBLESHOOTING: https://github.com/GoogleChrome/puppeteer/blob/master/d ocs/troubleshooting.md\n”
by installing libXScrnSaver.x86_64. Still not sure whats with the iframe setup. Will investigate further…
My only issue with “indirect proxy” is that it provides a “localhost” link when links are enabled in the grafana module setup.