picoroma
December 4, 2024, 7:59pm
1
I’m having an issue related to the GRAFANA Graph.
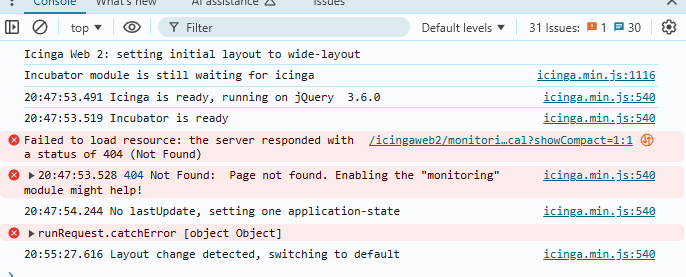
I have noticed (using the CHROME developer tools) that there are some error in the WEB PAGE:
I do not know if this is related to the switch to ICINGADB I recently performed. Mayby I miss something?
My “monitoring” module is disabled right now - But I remember that is a requirement of the ICINGADB.
ICINGA Scenario:
cinga Web 2 Version
2.12.1
Git commit
cd2daeb2cb8537c633d343a29eb76c54cd2ebbf2
PHP Version
7.4.3-4ubuntu2.23
Git commit date
2023-11-15
icinga/icinga-php-thirdparty
0.12.1
icinga/icinga-php-library
0.14.1
log1c
December 5, 2024, 12:47pm
2
Did you update your grafana recently and use Flux queries for your graphs?Then you might run into this issue:
opened 08:50AM - 28 Oct 24 UTC
type/bug
datasource/InfluxDB
type/regression
automated-triage
area/dashboard/variable
### What happened?
After upgrade to 11.3.0 _Flux_ queries in dashboards stopped… working when they were using variables.
### What did you expect to happen?
Dashboards queries work as before.
### Did this work before?
11.2.2 with security fix and after the downgrade to 11.2.3 data is shown (again)
### How do we reproduce it?
1. Have a dashboard with a variable of type constant and a Flux query


2. This yields "No data" in the dashboard when adding the required variables to the URL
3. Changing the query to fixed values and it works (tested using "Explore" option of the datasource)

### Is the bug inside a dashboard panel?
_No response_
### Environment (with versions)?
Grafana: 11.3.0
OS: Ubuntu 22.04.5
Browser: Chrome
### Grafana platform?
None
### Datasource(s)?
InfluxDB v2.7.10
picoroma
December 5, 2024, 2:56pm
3
In CHROME I can see error thare are related to “monitoring” module that is disabled dor using the ICINGADB:
picoroma
February 8, 2025, 5:32pm
4
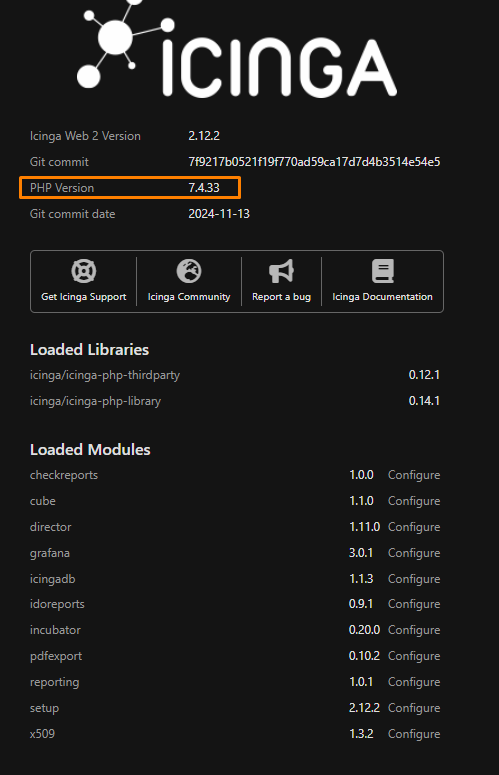
I have also UPDATED the GRAFANA MODULE to the lates one (3.0.1)
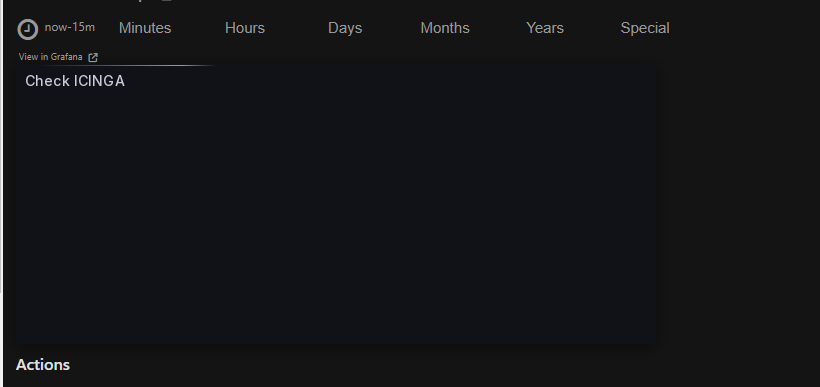
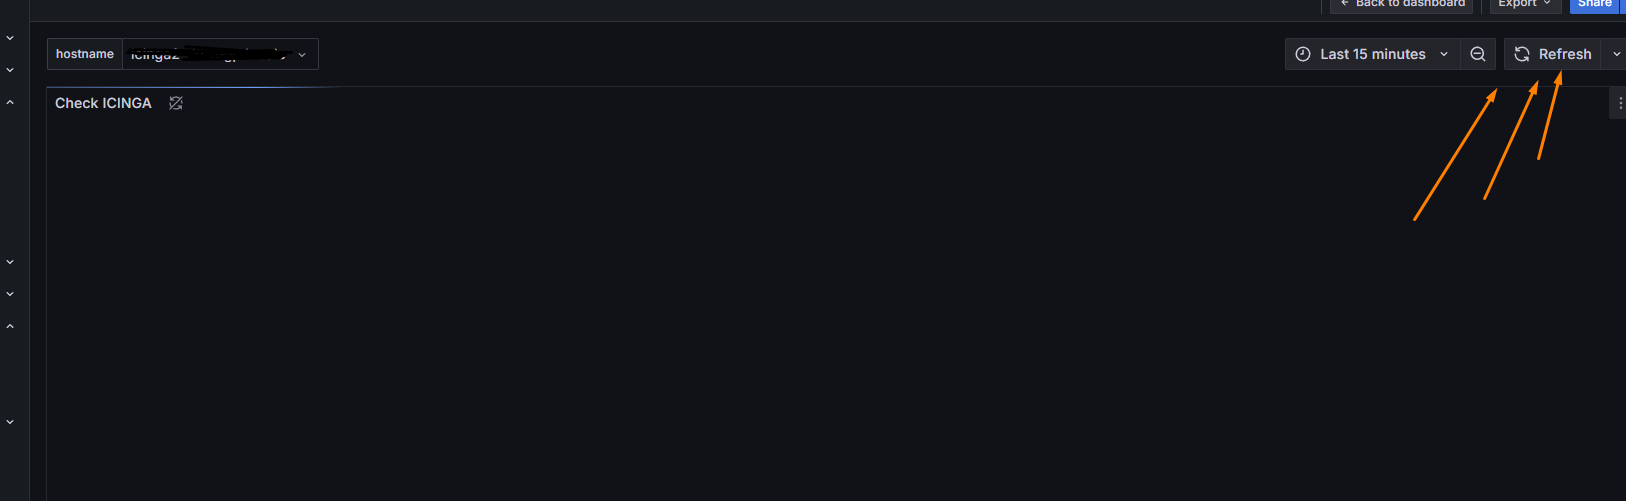
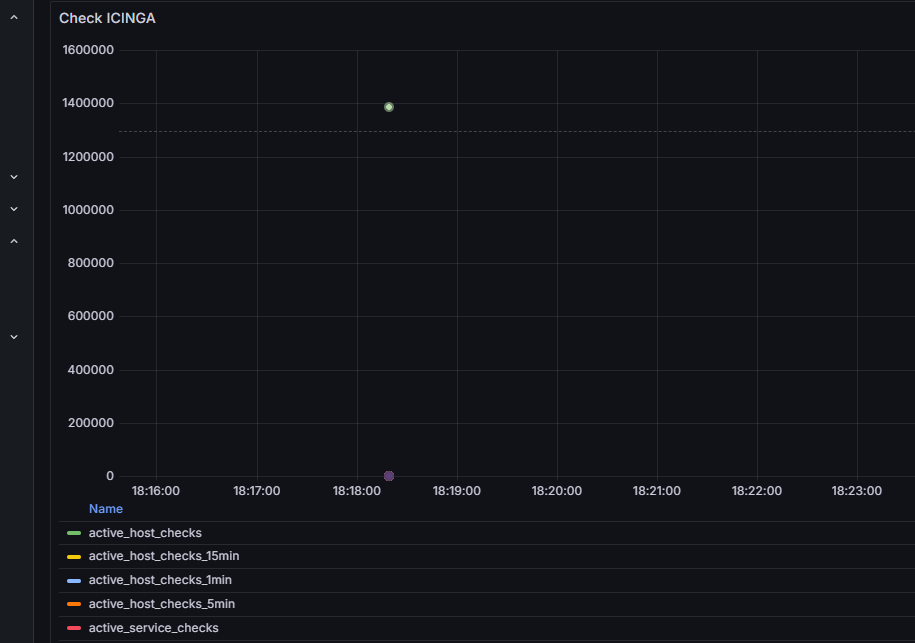
The GRAPH area is displayed but no data is SHOW into ICINGA.
BUt here from grafana - JUST a refresh of the GRAPH will show the data correctly
This is my Component version:
Can be the PHP version too OLD ?