I have got news.
As already mentioned I am using Icinga2 + IncluxDB + Grafana on a Raspberry Pi. It is the Pi 4 with Raspbian Buster.
I activated the check box “Show Debug” in the module configuration at the Icinga webinterface: Configuration → Module → Grafana. At the right site there are more informationsof the Grafana module. At the top you can click on “Configuration”. At the bottom of this dialog is the mentioned checl box called “Show Debug”.
If you already have installed and configured the Grafana module like @Mikesch_mp has been documenting (https://github.com/Mikesch-mp/icingaweb2-module-grafana/blob/master/doc/02-installation.md) you will get on every page where the grafan graph is missing … at the bottom of every page.
In my case ist looks like this for “ping4”:
I tokk this url and try to open it in a different braowser tab:
No I get the detailed error message which seems to be a problem only for users like me who have an ARM platform like raspbian:
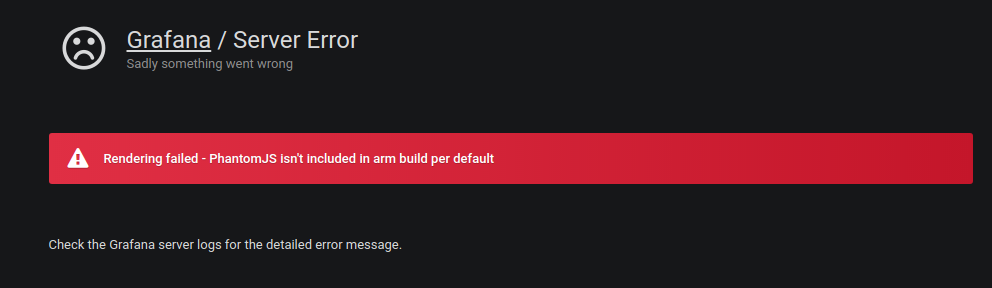
Now I try to find out if I can install PhantomJS or if I have to use a different package to get the grafana rendering working.
It seems to be a “feature” that PhantomJS is missing at the ARM platform. I think everybody using such a platform will face this problem.