Grafana and Grafana module - Both don't show graphs

Hello,

I try to configure grafana and grafana module with Icinga at the moment.
I am using …
Raspbian buster
Icinga 2.6.2
Grafana Module 1.3.6
Grafana 6.4.4
InfluxBD 1.6.4

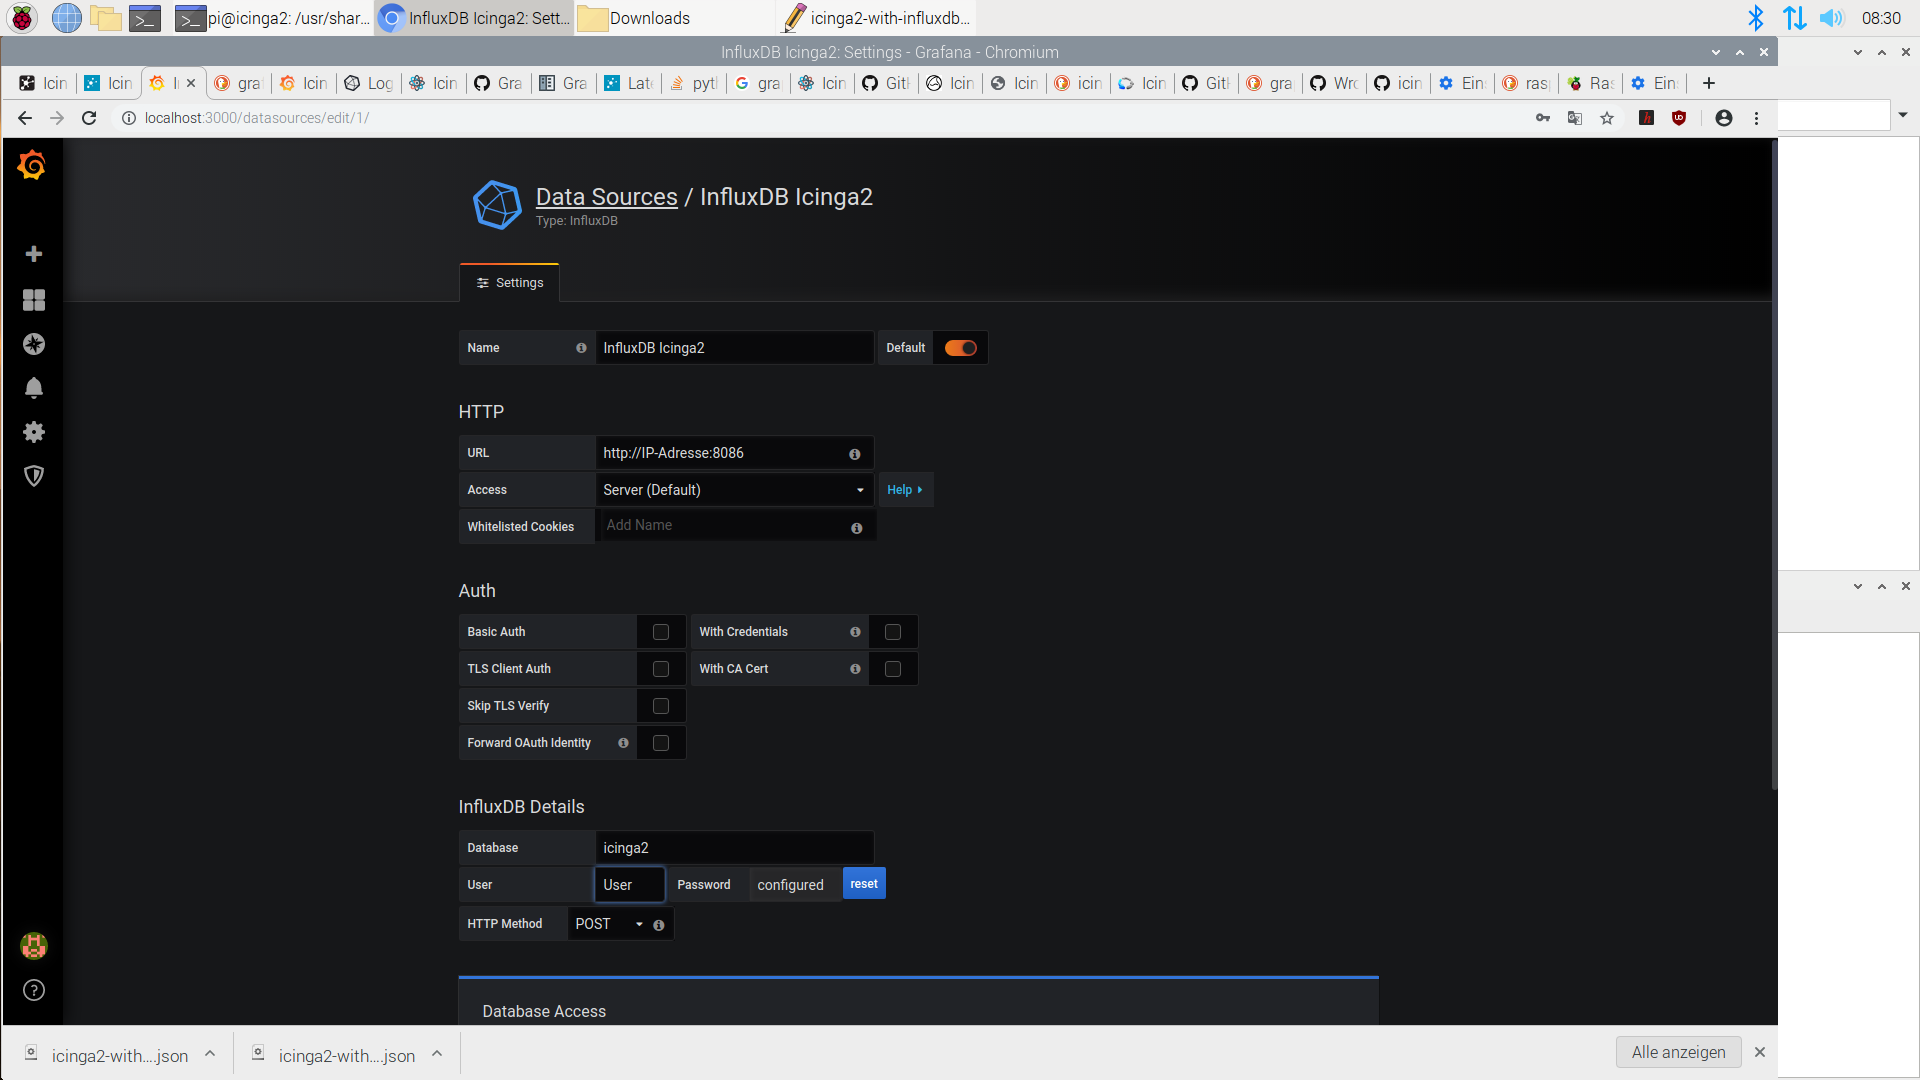
I installed an configured the InfluxDB with DB “icinga”, a user and password for the database.
I activated the feature at icinga2 and the database is growing. The Icinga2 metrics are wirtten to the DB:

SHOW MEASUREMENTS
name: measurements
name

Cpu-Mikrotik
Temperature-Mikrotik
check_temp_rack
disk
disk-windows
hostalive
load
load-windows
memory-windows
nscp-local
nscp-local-counter
ping4
procs
update-windows

SELECT * FROM ping4
1573283751000000000 0 1 0 4.207184 AP Sportzimmer 0.000979 3 true 0 1
1573283751000000000 0.2 AP Sportzimmer rta seconds 0.000354 0.1
1573283756000000000 0 1 0 4.196092 Router CapsMAN PoE 0.00069 3 true 0 1
1573283756000000000 0.2 Router CapsMAN PoE rta seconds 0.000304 0.1
1573283756000000000 15 Router CapsMAN PoE pl percent 0 5
1573283762000000000 0.2 AP Balkonzimmer rta seconds 0.000272 0.1
1573283762000000000 0 1 0 4.177309 AP Balkonzimmer 0.000964 3 true 0 1
1573283762000000000 15 AP Balkonzimmer pl percent 0 5
1573283843000000000 15 Router Zentral pl percent 0 5
1573283843000000000 0.2 Router Zentral rta seconds 0.000251 0.1
1573283843000000000 0 1 0 4.135432 Router Zentral 0.0018 3 true 0 1
1573284019000000000 0 1 0 4.059127 Switch Zentral 0.001262 3 true 0 1
1573284019000000000 0.2 Switch Zentral rta seconds 0.002425 0.1
1573284019000000000 0 1 0 4.186214 AP Terrasse 0.001767 3 true 0 1
1573284019000000000 15 AP Terrasse pl percent 0 5
1573284019000000000 0.2 AP Terrasse rta seconds 0.00035 0.1
1573284019000000000 15 Switch Zentral pl percent 0 5
1573284025000000000 0.2 AP Wohnzimmer rta seconds 0.00027 0.1
1573284025000000000 15 AP Wohnzimmer pl percent 0 5

After this i created a Data Source at Grafana:

“Test & Save” seems to be ok and everything seems working.
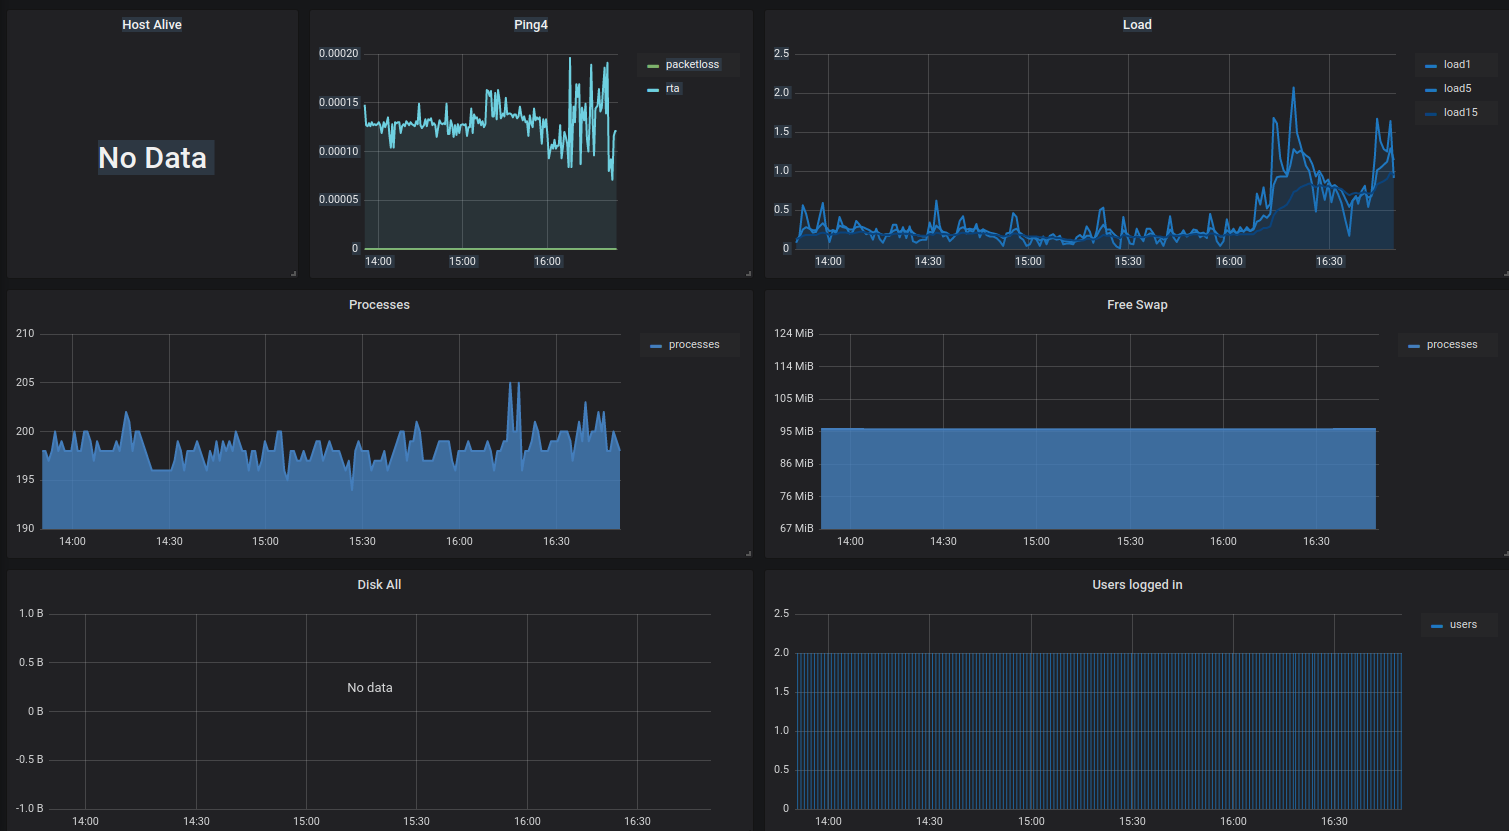
After this I imported the default dashboards of the grafana icinga2 module:
base.metrics.json
icinga2-default.json

I only gave them a UID of 100 and 200. Nothing else has been changed for import. At the “icinga2-default” dashboard I left hostname, service and a third variable “null”.
If I open the dashboards they are showing no data.

The next step is to get the graphs at Icinga2 running but I think Grafana should first show graphs befoire Icinga would. Is this correct?

I hope you have some ideas.

Regards,
Jens

I have got news.
As already mentioned I am using Icinga2 + IncluxDB + Grafana on a Raspberry Pi. It is the Pi 4 with Raspbian Buster.
I activated the check box “Show Debug” in the module configuration at the Icinga webinterface: Configuration → Module → Grafana. At the right site there are more informationsof the Grafana module. At the top you can click on “Configuration”. At the bottom of this dialog is the mentioned checl box called “Show Debug”.

If you already have installed and configured the Grafana module like @Mikesch_mp has been documenting (https://github.com/Mikesch-mp/icingaweb2-module-grafana/blob/master/doc/02-installation.md) you will get on every page where the grafan graph is missing … at the bottom of every page.
In my case ist looks like this for “ping4”:

http://localhost:3000/render/dashboard-solo/db/icinga2-default.json?var-hostname=HOSTNAME_OF_DEVICE&var-service=ping4&var-command=ping4&panelId=200&orgId=1&width=640&height=480&theme=light&from=now-6h&to=now

I tokk this url and try to open it in a different braowser tab:
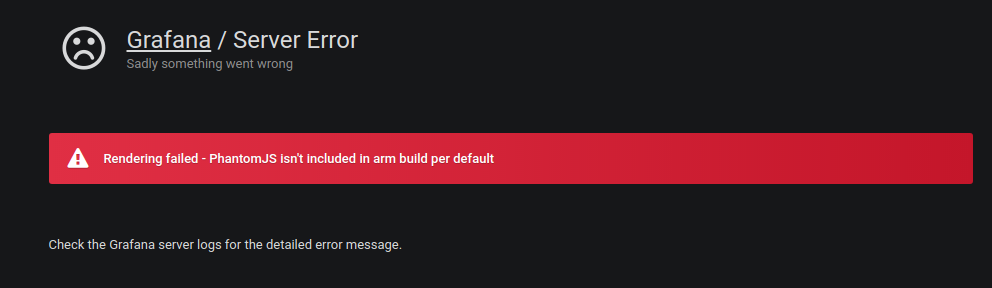
No I get the detailed error message which seems to be a problem only for users like me who have an ARM platform like raspbian:

Now I try to find out if I can install PhantomJS or if I have to use a different package to get the grafana rendering working.
It seems to be a “feature” that PhantomJS is missing at the ARM platform. I think everybody using such a platform will face this problem.

On arm you can try to use the renderer plugin, but i did not test it. Its posible that it is only for x86

Grafana says that this plugin is not for ARM. They say arm is low performance platform and therefore the render capability should not be implemented.
But I already try to get it installed and configured … and working. I hope I will get it up and running.

I think I got the grafana-image-renderer running.
I did it with the help of
https://community.openhab.org/t/tutorial-grafana-rendering-on-raspberry-pi/71777

I also hab to replace the node-module chromium binary by /usr/bin/chromium-browser.
But I also get some errors and no graphs.
This is the way I configured the grafana module:

[grafana]
version = "0"
host = "localhost:3000"
protocol = "http"
timerangeAll = "1w/w"
defaultdashboard = "icinga2-default"
defaultdashboardpanelid = "0"
defaultorgid = "1"
shadows = "0"
defaultdashboardstore = "db"
theme = "light"
datasource = "influxdb"
accessmode = "proxy"
height = "280"
width = "640"
enableLink = "no"
debug = "1"
authentication = "anon"

This is graphs.ini:

[hostsalive]
dashboard = "icinga2-default"
panelId = "2"
orgId = "1"
repeatable = "no"

If I use proxy as connection method the grafana.log shows the following mesages and I don’t get a graph:

`

t=2019-11-11T22:20:44+0100 lvl=info msg=“Request Completed” logger=context userId=0 orgId=0 uname= method=GET path=/render/dashboard-solo/db/icinga2-default status=302 remote_addr=192.168.120.201 time_ms=0 size=29 referer=

If I use “direct” it takes atime until loading stops and the logfile has the following information for me:

t=2019-11-11T22:07:03+0100 lvl=eror msg="Rendering failed." logger=context userId=1 orgId=1 uname=admin error="Rendering failed: Error: Protocol error: Connection closed. Most likely the page has been closed."
t=2019-11-11T22:07:03+0100 lvl=eror msg="Request Completed" logger=context userId=1 orgId=1 uname=admin method=GET path=/render/dashboard-solo/db/icinga2-default status=500 remote_addr=192.168.120.201 time_ms=31776 size=1722 referer=

Do you have any ideas?

Hi Carsten,

can you explain the module configuration a bit. I am not sure if I am missing something.
I don’t really know what the different connection modes mean. I have all installed in the same hardware and I don’t have special security requirements. Maybe I can find out what is going wrong if I understand the difference between direct, proxy, iFrame and so on.

The documentation shows module configuration with Grafana V.5. At every screenshot the box is checked. I am using Grafana 6.x. Is it correct that I don’t need a Dashboard UID if I use this Grafana version? Does the PanelID hast to be the same like in Grafana? And if it needs to be the same where do I find the PanelID in Grafana?
For “basic auth” I need to configure a organisation. Needs this organisation to be configured at Grafana? The documentation says for “direct mode” I can configure users which have to log in Grafana before. Is this optional? Or do I have to configure a special user?

I tried to configure like it is documented but I don’t really understand why and maybe this is the reason for all my problems. In this situation debugging is a bit difficult. Maybe you can help me bit to understand what is going on.

Thank you very much!

Hello Jens,

yes you need to enable v5 (which is now v5+). With v5 of grafana they introduced the UUID for dashboards, so i could not rely on dashboardname anymore. For the panel ids you need to put in the same as in your grafana dashboard. Mostly its 1 if you have only one panel per dashboard, but sometimes its 2 or if you have multiple panels in a dashboard you have to get the panel id you want to display inside of icingaweb2.

For authentication i strongly recomend you to use api key, just create it inside grafana with read only rights, so you dont need to take care about comapany names etc.

If you need more help, just write here or send a message.

Regards,
Carsten

Thanks for your answer. I will apply this changes later on and take a look what happens. You will get feedback or further questions :wink:
Thank you!

I configured the module this way:

[grafana]
version = "1"
host = "IP-ADDRESS:3000"
protocol = "http"
timerangeAll = "1w/w"
defaultdashboard = "icinga2-default"
defaultdashboardpanelid = "1"
defaultorgid = "1"
shadows = "0"
theme = "light"
datasource = "influxdb"
accessmode = "proxy"
debug = "1"
defaultdashboarduid = "200"
authentication = "token"
apitoken = "generated token for view only"
height = "280"
width = "640"
enableLink = "yes"
proxytimeout = "60"
usepublic = "no"

What do you think about?
This is the graphs.conf:

[hostalive]
dashboard = "icinga2-default"
panelId = "1"
orgId = "1"
repeatable = "no"
dashboarduid = "200"

[ping4]
dashboard = "icinga2-default"
panelId = "1"
orgId = "1"
repeatable = "no"
dashboarduid = "200"

I get the message, that graphana encounters an internal error (500) instead of a graph.
The grafana.log looks like this:

t=2019-11-12T16:40:57+0100 lvl=dbug msg="Error Error: Protocol error: Connection closed. Most likely the page has been closed." logger=rendering
t=2019-11-12T16:40:57+0100 lvl=dbug msg="    at assert (/var/lib/grafana/plugins/grafana-image-renderer/node_modules/puppeteer/lib/helper.js:283:11)" logger=rendering
t=2019-11-12T16:40:57+0100 lvl=dbug msg="    at Page.close (/var/lib/grafana/plugins/grafana-image-renderer/node_modules/puppeteer/lib/Page.js:930:5)" logger=rendering
t=2019-11-12T16:40:57+0100 lvl=dbug msg="    at Browser.<anonymous> (/var/lib/grafana/plugins/grafana-image-renderer/build/browser.js:94:32)" logger=rendering
t=2019-11-12T16:40:57+0100 lvl=dbug msg="    at Generator.throw (<anonymous>)" logger=rendering
t=2019-11-12T16:40:57+0100 lvl=dbug msg="    at rejected (/var/lib/grafana/plugins/grafana-image-renderer/build/browser.js:5:65)" logger=rendering
t=2019-11-12T16:40:57+0100 lvl=eror msg="Rendering failed." logger=context userId=0 orgId=1 uname= error="Rendering failed: Error: Protocol error: Connection closed. Most likely the page has been closed."
t=2019-11-12T16:40:57+0100 lvl=eror msg="Request Completed" logger=context userId=0 orgId=1 uname= method=GET path=/render/d-solo/200/icinga2-default status=500 remote_addr=IP-ADDRESS time_ms=32338 size=1722 referer=

t=2019-11-12T16:41:00+0100 lvl=dbug msg="Error Error: Protocol error: Connection closed. Most likely the page has been closed." logger=rendering
t=2019-11-12T16:41:00+0100 lvl=dbug msg="    at assert (/var/lib/grafana/plugins/grafana-image-renderer/node_modules/puppeteer/lib/helper.js:283:11)" logger=rendering
t=2019-11-12T16:41:00+0100 lvl=dbug msg="    at Page.close (/var/lib/grafana/plugins/grafana-image-renderer/node_modules/puppeteer/lib/Page.js:930:5)" logger=rendering
t=2019-11-12T16:41:00+0100 lvl=dbug msg="    at Browser.<anonymous> (/var/lib/grafana/plugins/grafana-image-renderer/build/browser.js:94:32)" logger=rendering
t=2019-11-12T16:41:00+0100 lvl=dbug msg="    at Generator.throw (<anonymous>)" logger=rendering
t=2019-11-12T16:41:00+0100 lvl=dbug msg="    at rejected (/var/lib/grafana/plugins/grafana-image-renderer/build/browser.js:5:65)" logger=rendering
t=2019-11-12T16:41:00+0100 lvl=eror msg="Rendering failed." logger=context userId=1 orgId=1 uname=admin error="Rendering failed: Error: Protocol error: Connection closed. Most likely the page has been closed."
t=2019-11-12T16:41:00+0100 lvl=eror msg="Request Completed" logger=context userId=1 orgId=1 uname=admin method=GET path=/render/d/200/icinga2-default status=500 remote_addr=[::1] time_ms=32861 size=1722 referer=

Do you have any ideas where to look? Or any suggestions what could be the problem?

If I use the Dashboard with ID “381” in Grafana - “Icinga2 and InfluxDB” - I get this after saying the dashboard which hostname to use:

For me it looks like Grafana and Influx is working. But grafana-image-renderer seems to be th problem …

The tenderer is your problem. Its sad, but arm is no longer supported. You have to move grafana itself to x86 OS or use the renderer docker container on a x86

Hi
Did anybody succeed to configure icinga2 with grafana 7 and the image renderer plugin? I get the grafana server error described by jens niffchen about localhost:3000. I have a intel xeon processor, so no arm problem.
What is needed in the grafana.ini file?

Thanks for any hints.
Matthias