Hi. I’m writing a web application which connects via the Icinga2 API.
We have simple host → parent dependencies (usually the local router).
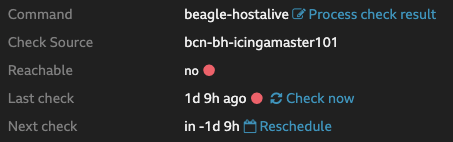
When a parent host goes down, all the dependent hosts have a nice red dot in the icingaweb UI showing that they’re unreachable.
Can I access this value in the API?
I know there’s the last_reachable value, but it’s not the same.
For example the host in the screenshot above has the following results in the API:
"attrs": {
            "__name": "myhostname",
            "acknowledgement": 0.0,
            "acknowledgement_expiry": 0.0,
            "acknowledgement_last_change": 0.0,
            "action_url": "",
            "active": true,
            "address": "172.1.1.2",
            "address6": "",
            "check_attempt": 1.0,
            "check_command": "beagle-hostalive",
            "check_interval": 300.0,
            "check_period": "",
            "check_timeout": null,
            "command_endpoint": "",
            "display_name": "My Display Name",
            "downtime_depth": 0.0,
            "enable_active_checks": true,
            "enable_event_handler": true,
            "enable_flapping": false,
            "enable_notifications": true,
            "enable_passive_checks": true,
            "enable_perfdata": true,
            "event_command": "",
            "flapping": false,
            "flapping_current": 0.0,
            "flapping_last_change": 0.0,
            "flapping_threshold": 0.0,
            "flapping_threshold_high": 30.0,
            "flapping_threshold_low": 25.0,
            "force_next_check": false,
            "force_next_notification": false,
            "groups": [
                "Group 1",
                "Group 2"
            ],
            "ha_mode": 0.0,
            "handled": false,
            "icon_image": "",
            "icon_image_alt": "",
            "last_check": 1612226517.014076,
            "last_check_result": {
                "active": true,
                "check_source": "bcn-bh-icingamaster101",
                "command": [
                    "/usr/lib/nagios/plugins/check_ping",
                    "-H",
                    "172.26.134.210",
                    "-c",
                    "5000,100%",
                    "-w",
                    "3000,80%"
                ],
                "execution_end": 1612226517.014026,
                "execution_start": 1612226512.978128,
                "exit_status": 0.0,
                "output": "PING OK - Packet loss = 0%, RTA = 0.59 ms",
                "performance_data": [
                    "rta=0.592000ms;3000.000000;5000.000000;0.000000",
                    "pl=0%;80;100;0"
                ],
                "schedule_end": 1612226517.014076,
                "schedule_start": 1612226512.9778428,
                "state": 0.0,
                "ttl": 0.0,
                "type": "CheckResult",
                "vars_after": {
                    "attempt": 1.0,
                    "reachable": true,
                    "state": 0.0,
                    "state_type": 1.0
                },
                "vars_before": {
                    "attempt": 1.0,
                    "reachable": true,
                    "state": 0.0,
                    "state_type": 1.0
                }
            },
            "last_hard_state": 0.0,
            "last_hard_state_change": 1607060168.122394,
            "last_reachable": true,
            "last_state": 0.0,
            "last_state_change": 1607060168.122394,
            "last_state_down": 0.0,
            "last_state_type": 1.0,
            "last_state_unreachable": 0.0,
            "last_state_up": 1612226517.014108,
            "max_check_attempts": 3.0,
            "name": "myhostname",
            "next_check": 1612345164.28,
            "next_update": 1612345472.3523662,
            "notes": "",
            "notes_url": "",
            "original_attributes": null,
            "package": "director",
            "paused": false,
            "previous_state_change": 1607060168.122394,
            "problem": false,
            "retry_interval": 60.0,
            "severity": 0.0,
            "source_location": {
                "first_column": 1.0,
                "first_line": 748.0,
                "last_column": 28.0,
                "last_line": 748.0,
                "path": "/var/lib/icinga2/api/packages/director/731ad983-7262-4f51-9476-77076e86f0ea/zones.d/master/hosts.conf"
            },
            "state": 0.0,
            "state_type": 1.0,
            "templates": [
                "Ubiquiti Unifi",
                "Beagle Device"
            ],
            "type": "Host",
            "vars": {
                "host_checkdns": true,
                "host_location": "",
                "host_manufacturer": "Ubiquiti",
                "host_model": "Unifi",
                "host_notificationgroups": [],
                "host_owner": "Department 1",
                "host_parenthost": "myparenthostname"
            },
            "version": 0.0,
            "volatile": false,
            "zone": "master"
        },
        "joins": {},
        "meta": {},
        "name": "myhostname",
        "type": "Host"
“myparenthostname” is down, but “myhostname” was up when the parent went down.
The dependency kicked in and there were no more checks for the host (which would find that the host was indeed ‘down’)
I’m guessing this is why last_reachable is still ‘true’ in this case, but that’s not much good to use in my web app.
Is there a way to get the value used for that red dot on the IcingaWeb UI?
(edited to add the following output from the DB:)
This the output from the relevant result in the mySql database - showing that the database knows that it’s not reachable (which is correct).
mysql> select * from icinga_hoststatus where host_object_id="990" \G
*************************** 1. row ***************************
                hoststatus_id: 66
                  instance_id: 1
               host_object_id: 990
           status_update_time: 2021-02-02 00:41:57
                       output: PING OK - Packet loss = 0%, RTA = 0.59 ms
                  long_output:
                     perfdata: rta=0.592000ms;3000.000000;5000.000000;0.000000 pl=0%;80;100;0
                 check_source: bcn-bh-icingamaster101
                current_state: 0
             has_been_checked: 1
          should_be_scheduled: 1
        current_check_attempt: 1
           max_check_attempts: 3
                   last_check: 2021-02-02 00:41:57
                   next_check: 2021-02-02 00:46:51
                   check_type: 0
            last_state_change: 2020-12-04 05:36:08
       last_hard_state_change: 2020-12-04 05:36:08
              last_hard_state: 0
                 last_time_up: 2021-02-02 00:41:57
               last_time_down: NULL
        last_time_unreachable: NULL
                   state_type: 1
            last_notification: NULL
            next_notification: 2021-02-02 00:41:53
        no_more_notifications: 0
        notifications_enabled: 1
problem_has_been_acknowledged: 0
         acknowledgement_type: 0
  current_notification_number: 0
       passive_checks_enabled: 1
        active_checks_enabled: 1
        event_handler_enabled: 1
       flap_detection_enabled: 0
                  is_flapping: 0
         percent_state_change: 0
                      latency: 0.000335
               execution_time: 4.035898
     scheduled_downtime_depth: 0
   failure_prediction_enabled: 0
     process_performance_data: 1
             obsess_over_host: 0
     modified_host_attributes: 0
          original_attributes: null
                event_handler: NULL
                check_command: beagle-hostalive
        normal_check_interval: 5
         retry_check_interval: 1
   check_timeperiod_object_id: 0
                 is_reachable: 0
           endpoint_object_id: 283
1 row in set (0.00 sec)
Thanks!


