shashil05
July 14, 2020, 9:45am
1
Hi,
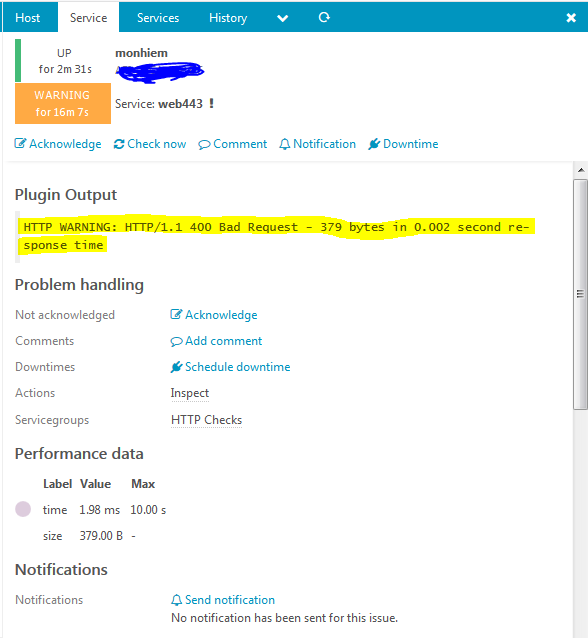
I’m trying to configure the REST API and getting the following error -
here is host file -
object Host “monhiem” {
address = “xxxxxxxxxxxxx”
object EventCommand “send_to_businesstool” {https://xxxxxxxxxxxx/api/cities ”
object Service “checking” {
check_command = “hostalive”
event_command = “send_to_businesstool”
and service file -
apply Service “web443” {
can someone help me out here?
Thanks,
Devin
July 14, 2020, 11:37am
2
can you check the Inspect link inside the service please.
shashil05
July 14, 2020, 12:31pm
3
Here is the screenshot for the inspect.
Here, is much more details of the Object Properties
Last Check Result
Executed Command
‘/usr/lib/nagios/plugins/check_http’ ‘-I’ ‘xxxxxxxxxxxxxxx’ ‘-p’ ‘443’ ‘-t’ ‘10’
Object Properties
__name
“monhiem!web443”
acknowledgement
0
acknowledgement_expiry
0
action_url
“”
active
true
check_attempt
1
check_command
http
check_interval
60
check_period
“”
check_timeout
null
command_endpoint
“”
display_name
“web443”
downtime_depth
0
enable_active_checks
true
enable_event_handler
true
enable_flapping
false
enable_notifications
true
enable_passive_checks
true
enable_perfdata
true
event_command
“”
flapping
false
flapping_current
0
flapping_last_change
0
flapping_threshold
0
flapping_threshold_high
30
flapping_threshold_low
25
force_next_check
false
force_next_notification
false
groups
http
ha_mode
0
handled
false
host_name
“monhiem”
icon_image
“”
icon_image_alt
“”
last_check
1594729891.464876
last_hard_state
1
last_hard_state_change
1594718256.884779
last_reachable
true
last_state
1
last_state_change
1594718170.047451
last_state_critical
0
last_state_ok
0
last_state_type
1
last_state_unknown
0
last_state_unreachable
0
last_state_warning
1594729891.464884
max_check_attempts
5
name
“web443”
next_check
1594729951.460000
notes
“”
notes_url
“”
original_attributes
null
package
“_etc”
paused
false
previous_state_change
1594718170.047451
problem
true
retry_interval
30
severity
40
state
1
state_type
1
type
“Service”
vars
{ http_port: “443”, http_timeout: “10” }
version
0
volatile
false
zone
“”
ERROR LOG when I hit check now
Returning 400 means that the request was malformed. In other words, the data stream sent by the client to the server didn’t follow the rules. The client SHOULD NOT repeat the request without modifications. It means that the request itself has somehow incorrect or corrupted and the server couldn’t understand it. The server is refusing to service the request because the entity of the request is in a format not supported by the requested resource for the requested method . Therefore, it prevents the website from being properly displayed. To fix a 400 Bad Request error, it is best to start diagnosing the issue from the client side itself. Complete the steps outlined in this section to help diagnose and correct the error.
Check for errors in the URL.
Clear Browser Cache and cookies.
Clear DNS Cache.
Check your File upload Size.
Deactivate Browser Extensions.