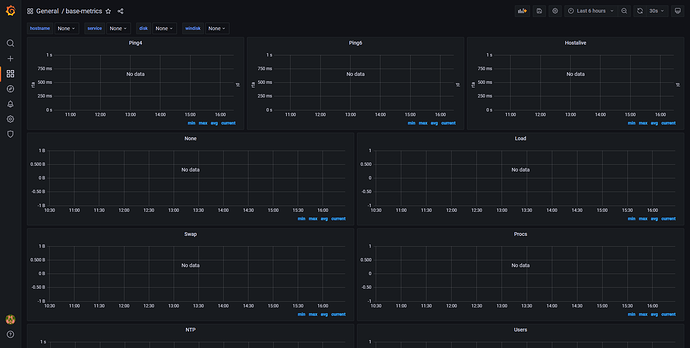
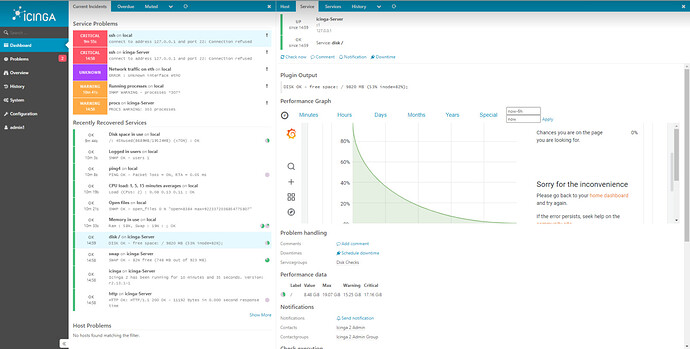
Hello, i installed grafana according to this site and all hosts and services have no data
GitHub - chrisss404/icinga2-influxdb-grafana: Setup guide for Icinga2 with Grafana integration employing InfluxDB.
i don’t know where to start fixing the error can anyone give me a hint, thanks

