Icinga2-version: r2.13.2-1
Icingaweb2-version: 2.10.0
php-version: 7.4.3
OS: Ubuntu20:04
Hello,
I firstly have to admit, that i am pretty new to Icinga2
We have an Icinga2 and Icingaweb2-Setup which works fine.
The Icinga2-setup was already set before I began to manage it.
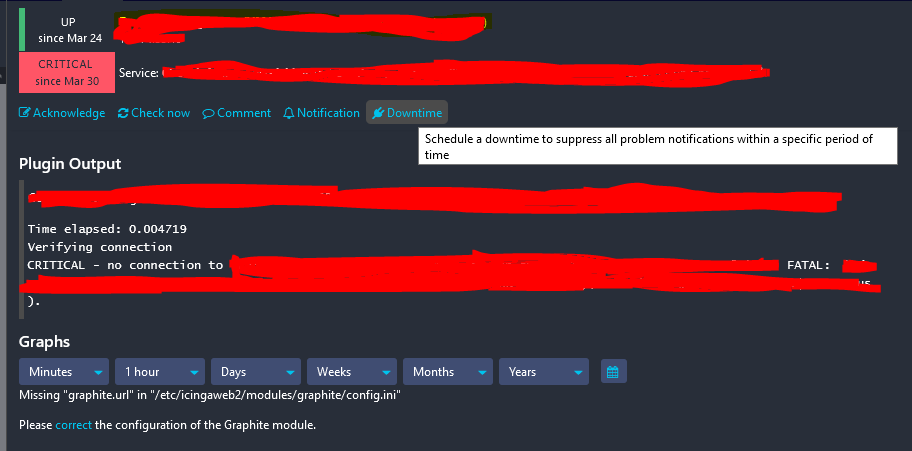
The only problem we have, is that the downtimes via Icingaweb2 are not working if you try to apply one.
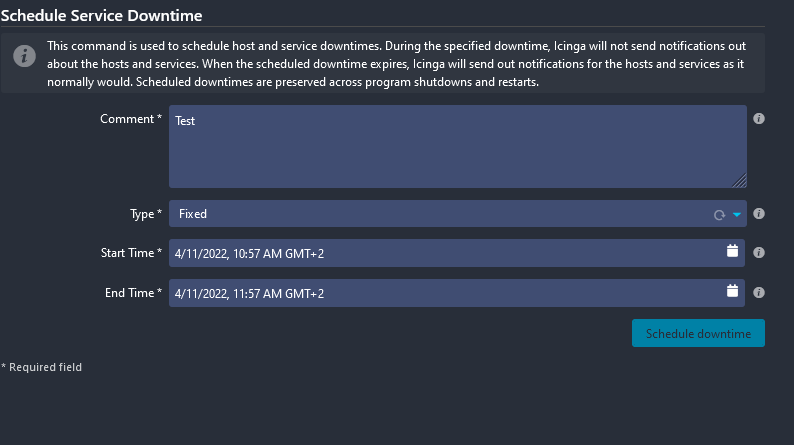
For example: I want to set a service- or host-downtime.
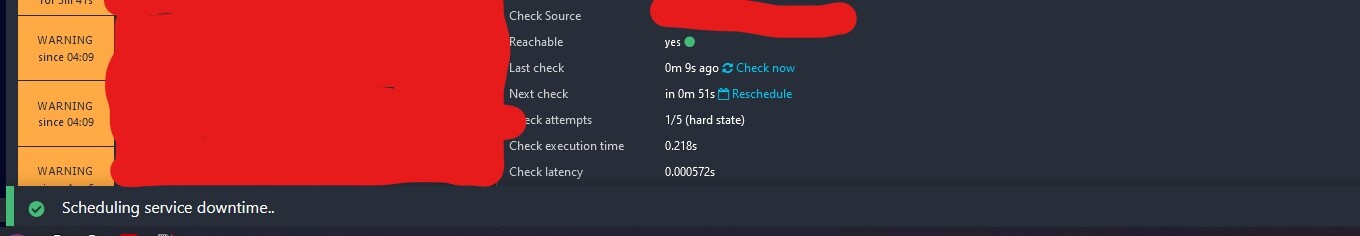
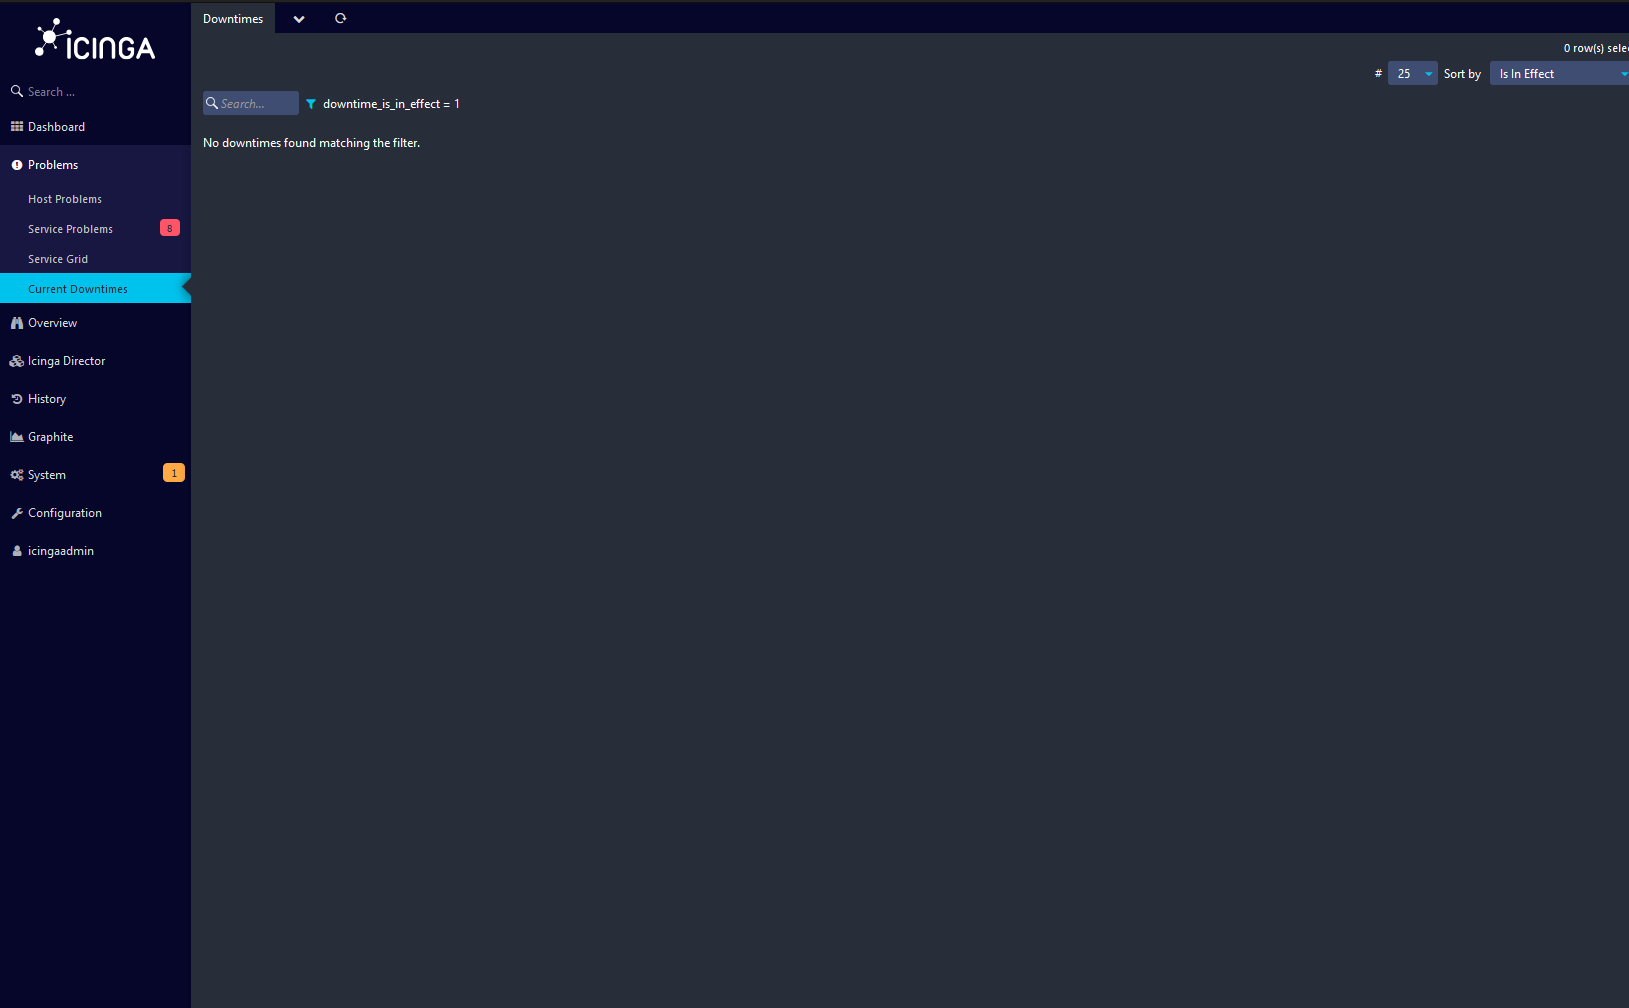
When I try to apply it, neither the downtime appears in the downtimes-section nor it seems that the downtime is applied and we also don’t recieve any notifications about it.
I only get the “scheduling service downtime” notification in the browser.
In the /etc/icinga2/conf.d folder, the downtimes.conf-file still has it’s default configuration:
/**
 * The example downtime apply rule.
 */

apply ScheduledDowntime "backup-downtime" to Service {
  author = "icingaadmin"
  comment = "Scheduled downtime for backup"

  ranges = {
    monday = service.vars.backup_downtime
    tuesday = service.vars.backup_downtime
    wednesday = service.vars.backup_downtime
    thursday = service.vars.backup_downtime
    friday = service.vars.backup_downtime
    saturday = service.vars.backup_downtime
    sunday = service.vars.backup_downtime
  }

  assign where service.vars.backup_downtime != ""
}
Feature list:
$ icinga2 feature list
Disabled features: command debuglog elasticsearch gelf icingadb influxdb influxdb2 livestatus opentsdb perfdata syslog
Enabled features: api checker compatlog graphite ido-mysql mainlog notification statusdata
Modules:
$icingacli module list
MODULE         VERSION   STATE     DESCRIPTION
director       1.6.0     enabled   Director - Config tool for Icinga 2
graphite       1.1.0     enabled   Icinga Graphite module
migrate        2.10.0    enabled   Migrate module
monitoring     2.10.0    enabled   Icinga monitoring module
Does somebody know where the problem is or if there is anything missing in my icinga-configuration ?
Looking forward for help !
Welcome to the Icinga community @regular_user1998.
Does any of the Icingaweb2 API work? Are you able to check a host or service by clicking the ‘Check Now’ link on the main page? Does a yellow bar show up at the bottom of the screen when you do a API command?
Please check the api-users.conf file for a icingaweb2 user. This user is required for Icingaweb2 API to work correctly. When you do a Icingaweb2 API command an entry will show in the icinga2.log file also. Do you see this in the logs?
Regards
Alex
Hello @aclark6996 ,
thank you very much for your support !
Unfortunately the Icingaweb2-API doens’t seem to work that well, even though the API-Setup is enabled and the api-user is configured.
The api-users.conf-file:
/**
 * The ApiUser objects are used for authentication against the API.
 */
object ApiUser "root" {
  password = "xxxxxxxxxxxx"
  // client_cn = ""

  permissions = [ "*" ]
}
When I, for example, click on 'Check Now’ on a host or service or try to set a downtime, the action doesn’t seem to appear in the icinga2-log file:
$tail -f /var/log/icinga2/icinga2.log
[2022-04-12 08:06:42 +0200] information/Checkable: Notifications are disabled for checkable '<HOSTNAME>'!procs'.
[2022-04-12 08:07:49 +0200] information/IdoMysqlConnection: Pending queries: 9 (Input: 18/s; Output: 19/s)
[2022-04-12 08:08:29 +0200] information/WorkQueue: #5 (ApiListener, RelayQueue) items: 0, rate: 30.5/s (1830/min 9220/5min 27790/15min);
[2022-04-12 08:08:35 +0200] information/ConfigObject: Dumping program state to file '/var/lib/icinga2/icinga2.state'
[2022-04-12 08:08:59 +0200] information/WorkQueue: #6 (ApiListener, SyncQueue) items: 0, rate:  0/s (0/min 0/5min 0/15min);
[2022-04-12 08:12:39 +0200] information/Checkable: Notifications are disabled for checkable '<HOSTNAME>!procs'.
[2022-04-12 08:12:59 +0200] information/IdoMysqlConnection: Pending queries: 11 (Input: 20/s; Output: 20/s)
[2022-04-12 08:13:35 +0200] information/ConfigObject: Dumping program state to file '/var/lib/icinga2/icinga2.state'
[2022-04-12 08:13:39 +0200] information/WorkQueue: #5 (ApiListener, RelayQueue) items: 0, rate: 30.5/s (1830/min 9216/5min 27746/15min);
[2022-04-12 08:14:09 +0200] information/WorkQueue: #6 (ApiListener, SyncQueue) items: 0, rate:  0/s (0/min 0/5min 0/15min);
I also don’t see a yellow bar by doing an api-command., although the api-call’s via the commandline itself seem to work.
Test-API-call:
curl -k -s -S -i -u root:xxxxxxxx 'https://localhost:5665/v1'
HTTP/1.1 200 OK
Server: Icinga/r2.13.2-1
Content-Type: text/html
Content-Length: 351

<html><head><title>Icinga 2</title></head><h1>Hello from Icinga 2 (Version: r2.13.2-1)!</h1><p>You are authenticated as <b>root</b>. Your user has the following permissions:</p> <ul><li>*</li></ul><p>More information about API requests is available in the <a href="https://icinga.com/docs/icinga2/latest/" target="_blank">documentation</a>.</p></html>
You are missing the Icingaweb2 API user. See the online documentation here.
You also need to setup the same user in the Icingaweb2. Go to ‘Monitoring’ module in Icingaweb (under backend tab) and add the Icingaweb2 user under ‘command transports’.
Regards
Alex
1 Like
Got it, now I know what was missing !
It works now.
Thanks you very much !