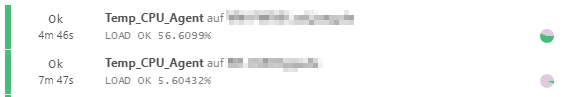
since yesterday i´ve got an display error. All checks are overdue, BUT give a response and values
When i restart the icinga2 service, then it says ok. But in a few minutes there is the problem aigain…
My Icinga2 configuration is one master and two satellites with the version: r2.12.0-1.
I restarted the icinga2 service now, then is every fine, it didin´t show the clock on the template.
But in a few minutes, the clock will be on the template and the template is grey. But i got the real time values like Load, …, so there have to be problem with the sync of the check time or something else.
Check if the time is correct on the master/agent. Is NTP active and checked?
Check what the icinga2.log says on both the master and the agent.
Either there is a time difference between the nodes or another problem that hopefully can be seen in the logs.