I tried to configure a new host with icinga2 director but the message “No graphs found” only appear as a result in graphite.
Do you have any idea because the master host icinga2 appears without any problems and I did not found any sample especially for a windows server host ?
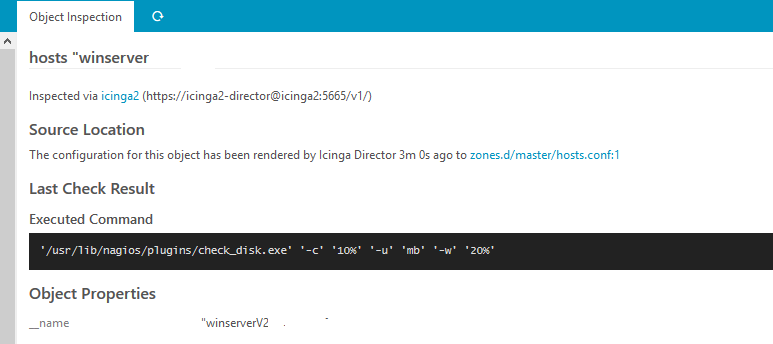
please share the corresponding output for that service from Icinga Web 2, especially use “inspect” from the detail view to analyse the check result. If your plugin does not provide any performance data, no metrics can be parsed and written into Graphite.
Please also share the used CheckCommand and underlaying plugin script.
that host shouldn’t execute a service check for disks, right? Do that on the service level, the Director doesn’t allow for command endpoint checks on the host object.
The full service check output and performance data is important, as otherwise the Graphite feature won’t be able to parse any metrics. To re-iterate: Navigate into the service detail view, pick Inspect and post the full content of that page.
If that doesn’t work out, you can also use the REST API for this described here: