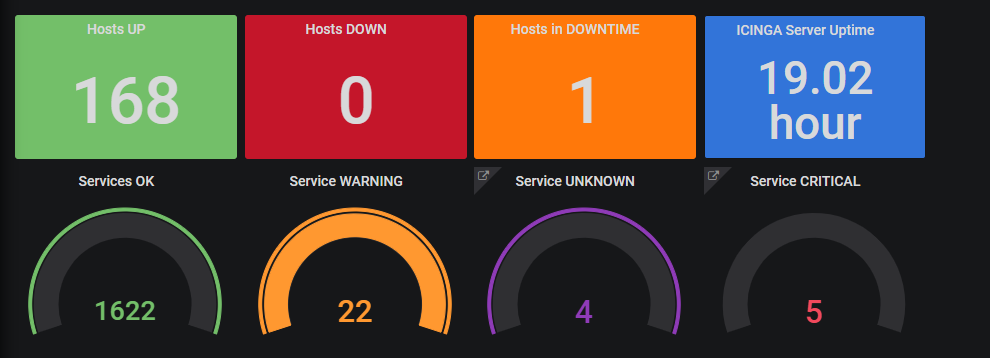
Unfortunately these data are not correct due to fact that in the same time in Icinga I do not have any HOST in downtime, but GRAFANA (INfluxDB) report 1 Host in downtime
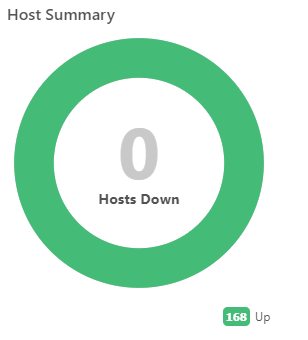
I have a total of 168 host so In this moment all host are UP… But grafana reports 1 host in downtime!
I agree with you…
But there is always a delay from result from ICINGA and the same date reported in GRAFANA by INFLUXDB…
Is there a way to keep more in sync these two sources ?
What’s in the tactical overview here doesn’t negate what the grafana dashboard is saying. Something is likely in a healthy state but downtimed. Tactical overview will show Up hosts as solid green, but downtimed hosts in Warn, Crit, or Unknown state will be a faded color meaning “handled”. Icinga sends data to both IDO and your TSDB at regular intervals, so there shouldn’t be much of a noticeable difference.
The problem was that the default timeframe in Grafana was 6 hours which led to the inclusion of some state changes that happened in those 6 hours. If you try and set the timeframe to 5min, it should show identical results.