I’ve got one of my final graphs which isn’t working, it’s going to be down to my miss-configuration, but I can’t see the issue.
The error message I’m getting is Cannot fetch graph with curl: 'Operation timed out after 5001 milliseconds with 0 bytes received'.
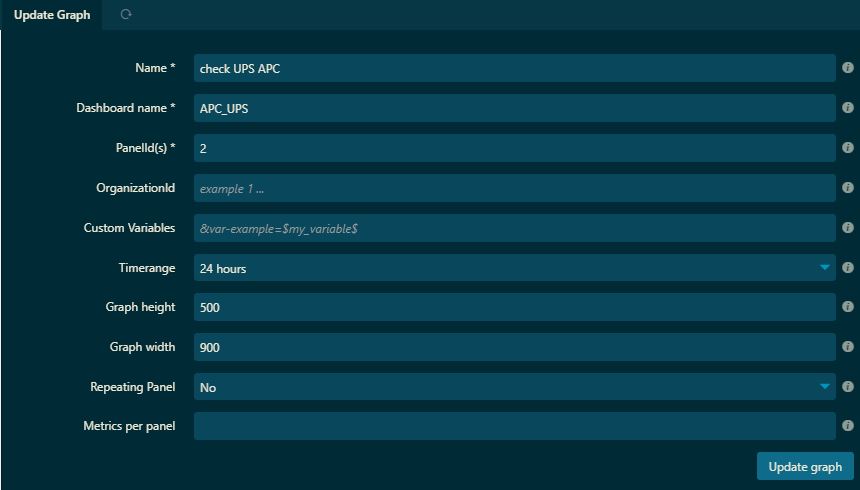
Is there a simple way I can see the actual request that Icinga sends to Grafana so I can debug the parameters.
My configuration is as follows, if anyone has a quick idea. All other graphs are working, so I’m sure the infra is fine.
template Service "check UPS APC" {
            check_command = "[check_ups_apc]
            check_interval = 5m
             vars.snmp_address = "$host.address$"
             vars.snmp_community = "public" }
Graph
{
  "datasource": "InfluxDB",
  "aliasColors": {},
  "bars": false,
  "dashLength": 10,
  "dashes": false,
  "fill": 1,
  "fillGradient": 0,
  "gridPos": {
    "h": 12,
    "w": 24,
    "x": 0,
    "y": 0
  },
  "hiddenSeries": false,
  "id": 2,
  "interval": "",
  "legend": {
    "alignAsTable": true,
    "avg": true,
    "current": true,
    "max": true,
    "min": true,
    "show": true,
    "total": false,
    "values": true
  },
  "lines": true,
  "linewidth": 1,
  "nullPointMode": "null",
  "options": {
    "dataLinks": []
  },
  "percentage": false,
  "pointradius": 2,
  "points": false,
  "renderer": "flot",
  "seriesOverrides": [
    {
      "alias": "Load",
      "color": "rgb(0, 255, 25)",
      "fill": 4,
      "fillGradient": 8,
      "linewidth": 2
    },
    {
      "alias": "Capacity",
      "color": "rgb(220, 255, 0)",
      "fillGradient": 1,
      "linewidth": 2
    },
    {
      "alias": "On Battery",
      "color": "rgb(250, 0, 30)",
      "fillGradient": 5,
      "linewidth": 3,
      "yaxis": 2
    },
    {
      "alias": "Remaining",
      "color": "rgb(255, 0, 246)",
      "fill": 0,
      "fillGradient": 0,
      "linewidth": 3,
      "yaxis": 2
    }
  ],
  "spaceLength": 10,
  "stack": false,
  "steppedLine": true,
  "targets": [
    {
      "alias": "On Battery",
      "groupBy": [
        {
          "params": [
            "$__interval"
          ],
          "type": "time"
        },
        {
          "params": [
            "null"
          ],
          "type": "fill"
        }
      ],
      "measurement": "check_ups_apc",
      "orderByTime": "ASC",
      "policy": "default",
      "refId": "A",
      "resultFormat": "time_series",
      "select": [
        [
          {
            "params": [
              "value"
            ],
            "type": "field"
          },
          {
            "params": [],
            "type": "distinct"
          }
        ]
      ],
      "tags": [
        {
          "key": "hostname",
          "operator": "=~",
          "value": "/^$hostname$/"
        },
        {
          "condition": "AND",
          "key": "service",
          "operator": "=~",
          "value": "/^$service$/"
        },
        {
          "condition": "AND",
          "key": "metric",
          "operator": "=",
          "value": "on_battery_sec"
        }
      ]
    },
    {
      "alias": "Load",
      "groupBy": [
        {
          "params": [
            "$__interval"
          ],
          "type": "time"
        },
        {
          "params": [
            "null"
          ],
          "type": "fill"
        }
      ],
      "measurement": "check_ups_apc",
      "orderByTime": "ASC",
      "policy": "default",
      "refId": "B",
      "resultFormat": "time_series",
      "select": [
        [
          {
            "params": [
              "value"
            ],
            "type": "field"
          },
          {
            "params": [],
            "type": "distinct"
          }
        ]
      ],
      "tags": [
        {
          "key": "hostname",
          "operator": "=~",
          "value": "/^$hostname$/"
        },
        {
          "condition": "AND",
          "key": "service",
          "operator": "=",
          "value": "check UPS APC"
        },
        {
          "condition": "AND",
          "key": "metric",
          "operator": "=",
          "value": "load"
        }
      ]
    },
    {
      "alias": "Capacity",
      "groupBy": [
        {
          "params": [
            "$__interval"
          ],
          "type": "time"
        },
        {
          "params": [
            "null"
          ],
          "type": "fill"
        }
      ],
      "measurement": "check_ups_apc",
      "orderByTime": "ASC",
      "policy": "default",
      "refId": "C",
      "resultFormat": "time_series",
      "select": [
        [
          {
            "params": [
              "value"
            ],
            "type": "field"
          },
          {
            "params": [],
            "type": "distinct"
          }
        ]
      ],
      "tags": [
        {
          "key": "hostname",
          "operator": "=~",
          "value": "/^$hostname$/"
        },
        {
          "condition": "AND",
          "key": "service",
          "operator": "=",
          "value": "check UPS APC"
        },
        {
          "condition": "AND",
          "key": "metric",
          "operator": "=",
          "value": "capacity"
        }
      ]
    },
    {
      "alias": "Remaining",
      "groupBy": [
        {
          "params": [
            "$__interval"
          ],
          "type": "time"
        },
        {
          "params": [
            "null"
          ],
          "type": "fill"
        }
      ],
      "measurement": "check_ups_apc",
      "orderByTime": "ASC",
      "policy": "default",
      "refId": "D",
      "resultFormat": "time_series",
      "select": [
        [
          {
            "params": [
              "value"
            ],
            "type": "field"
          },
          {
            "params": [],
            "type": "distinct"
          }
        ]
      ],
      "tags": [
        {
          "key": "hostname",
          "operator": "=~",
          "value": "/^$hostname$/"
        },
        {
          "condition": "AND",
          "key": "service",
          "operator": "=~",
          "value": "/^$service$/"
        },
        {
          "condition": "AND",
          "key": "metric",
          "operator": "=",
          "value": "remaining_sec"
        }
      ]
    }
  ],
  "thresholds": [],
  "timeFrom": null,
  "timeRegions": [],
  "timeShift": null,
  "title": "$hostname",
  "tooltip": {
    "shared": true,
    "sort": 1,
    "value_type": "individual"
  },
  "type": "graph",
  "xaxis": {
    "buckets": null,
    "mode": "time",
    "name": null,
    "show": true,
    "values": []
  },
  "yaxes": [
    {
      "decimals": null,
      "format": "percent",
      "label": "",
      "logBase": 1,
      "max": "100",
      "min": "0",
      "show": true
    },
    {
      "decimals": null,
      "format": "s",
      "label": null,
      "logBase": 1,
      "max": null,
      "min": null,
      "show": true
    }
  ],
  "yaxis": {
    "align": false,
    "alignLevel": null
  }
}