Hi,
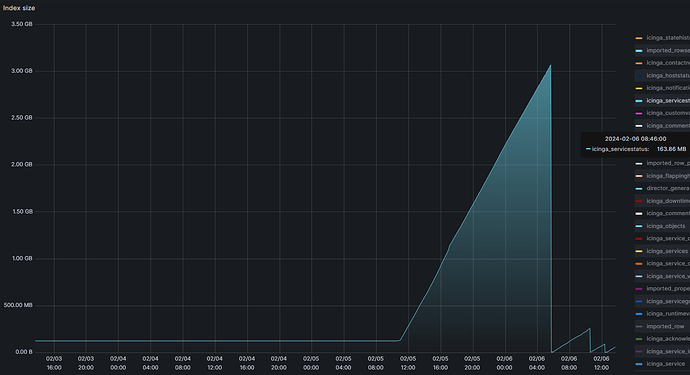
Since yesterday we have a problem where the icinga2 master node updates the tables icinga_servicestatus and icinga_hoststatus continuously with an incredibly high frequency. Severel times per second.
The SQL statements all have the nature of the following example:
UPDATE icinga_servicestatus SET acknowledgement_type = '0', active_checks_enabled = '1', check_command = '_nrpe', check_source = 'satellite server hostname', check_timeperiod_object_id = NULL, check_type = '0', current_check_attempt = '1', current_notification_number = '0', current_state = '0', endpoint_object_id = 225, event_handler_enabled = '1', execution_time = '0.075727', flap_detection_enabled = '1', has_been_checked = '1', instance_id = 1, is_flapping = '0', is_reachable = '1', last_check = TO_TIMESTAMP(1707222804) AT TIME ZONE 'UTC', last_hard_state = '0', last_hard_state_change = TO_TIMESTAMP(1705968617) AT TIME ZONE 'UTC', last_notification = TO_TIMESTAMP(1688098366) AT TIME ZONE 'UTC', last_state_change = TO_TIMESTAMP(1705968617) AT TIME ZONE 'UTC', last_time_critical = TO_TIMESTAMP(1705968560) AT TIME ZONE 'UTC', last_time_ok = TO_TIMESTAMP(1707222804) AT TIME ZONE 'UTC', last_time_unknown = TO_TIMESTAMP(1619121479) AT TIME ZONE 'UTC', last_time_warning = NULL, latency = '0.000309', long_output = '', max_check_attempts = '11', next_check = TO_TIMESTAMP(1707222862) AT TIME ZONE 'UTC', next_notification = TO_TIMESTAMP(1707221879) AT TIME ZONE 'UTC', normal_check_interval = '1', notifications_enabled = '1', original_attributes = 'null', output = 'DISK OK - free space: / 1812 MB (29.54% inode=97%);', passive_checks_enabled = '1', percent_state_change = '0', perfdata = '/=4321MB;4907;5520;0;6134', problem_has_been_acknowledged = '0', process_performance_data = '1', retry_check_interval = '1', scheduled_downtime_depth = '0', service_object_id = 13310, should_be_scheduled = '1', state_type = '1', status_update_time = TO_TIMESTAMP(1707222804) AT TIME ZONE 'UTC' WHERE service_object_id = 13310
Version used (icinga2 --version)
r2.13.6-1
Operating System and version
  Platform: Amazon Linux
  Platform version: 2
  Kernel: Linux
  Kernel version: 5.15.117-73.143.amzn2.x86_64
  Architecture: x86_64
Enabled features (icinga2 feature list)
Disabled features: command compatlog debuglog elasticsearch gelf graphite icingadb influxdb2 livestatus opentsdb perfdata statusdata
Enabled features: api checker ido-pgsql influxdb mainlog notification syslog
Icinga Web version
| Icinga Web 2 Version | 2.10.5 |
|---|---|
| Git commit | e9f0b266bd62ca01b76177db2fe1c292b3ce859b |
| PHP Version | 8.0.28 |
| Git commit date | 2023-01-26 |
We run a cluster with around 10 satellites and 2 masters
The CPU usage is very high on the database due to this and the system is unstable.
Here is a graph of the table size for icinga_servicestatus the last 3 days.
We have manually gone in an cleaned up the table after this problem started. Before it happened it was not increasing so it seems something is triggering this behaviour lately. We have not done any updates for some time that could be the cause for this.
Does anybody have an idea or do you know what could be the problem and how we can resolve it?
