Icinga Monitoring Satelite has been running in Container Station from QNAP in LXC Instance for years without any problems.
Now LXC Container is deprecated and we moved everything to LXD Container with migration tool.
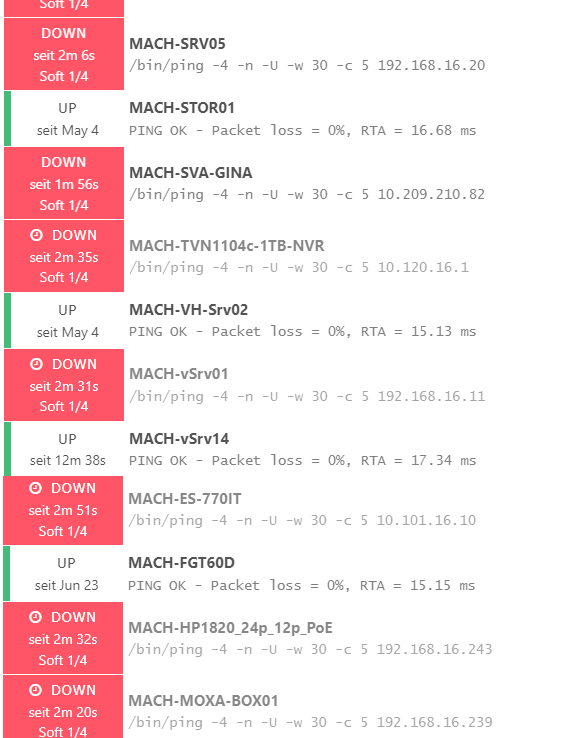
When we start LXD Container, Icinga runs without error messages (all configuration is identical like in LXC Container), but still notifications about devices followed by a Icinga satellite look like “DOWN”.
Has anybode some clue why that so is?
Hello, I’ve checked Logs from Icinga in LXC and Icinga in LXD, and only two Logs waren’t identical:
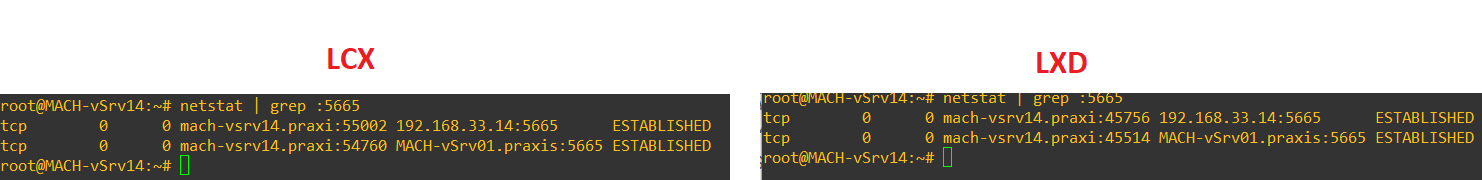
On LXC:
notice/WorkQueue: Spawning WorkQueue threads for ‘Js onRpcConnection, #1’
On LXD:
notice/WorkQueue: Spawning WorkQueue threads for ‘Js onRpcConnection, #0’
And one more Log:
On LXC:
notice/Process: PID 8169 (’/usr/lib/nagios/plugins/c heck_ping’ ‘-H’ ‘192.168.16.239’ ‘-c’ ‘5000,100%’ ‘-t’ ‘5’ ‘-w’ ‘3000,80%’) term inated with exit code 0
On LXD:
notice/Process: PID 751 (’/usr/lib/nagios/plugins/check_ping’ ‘-H’ ‘192.168.16.239’ ‘-c’ ‘900,15%’ ‘-t’ ‘5’ ‘-w’ ‘450,5%’) terminated with exit code 3
Does anyone know what “Js onRpcConnection, #0” and “terminated with exit code 3” mean?
Tnx
thank you very much for a reply. I’ve also thought that “exit code 3” nothing good is. Any clue, what to change in configuration in order that “exit code 0” again happen?
Can you attach to the container and run the check to get the output? Perhaps the output gives you a hint. My blind guess would be a networking problem.
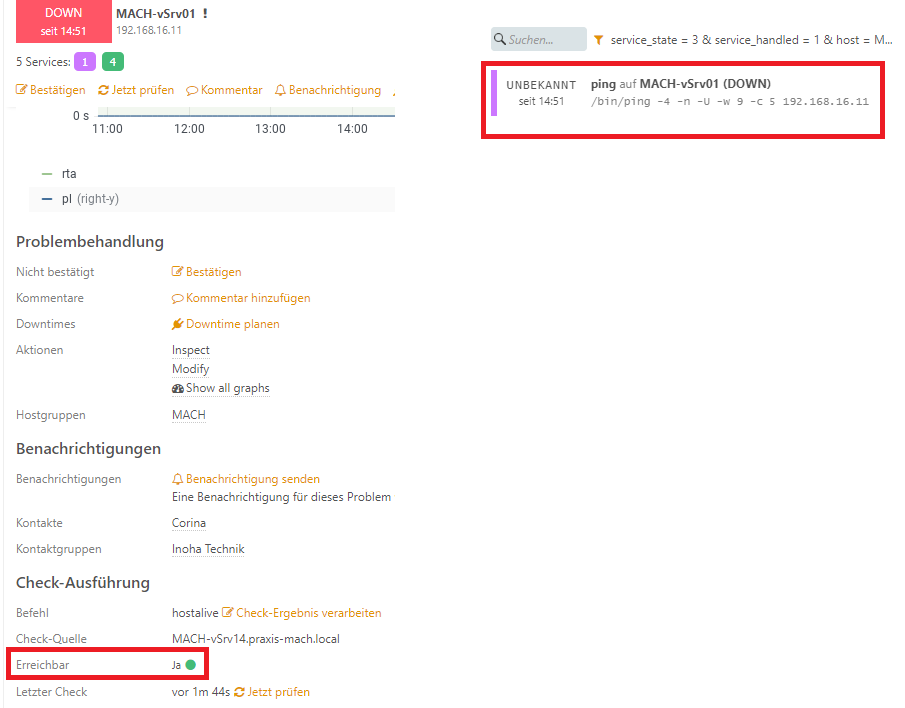
it’s possible, but all devices that are “DOWN” can Ping Icinga Srv in LXD and vice versa.New MAC Adress from Icinga Srv in LXD is in ARP Table from devices that “DOWN” are. When we see from Icinga Master one “DOWN” device, we see that this device available is, but
but can’t read ping.