Hello,
i’m running Graphite with my Icinga2. I’m currently trying to understand, how i can merge all metrics from a Service into a single graph. The Documentation ( icingaweb2-module-graphite/04-Templates.md at master · Icinga/icingaweb2-module-graphite · GitHub ) mentions:
To dynamically render a graph for each performance data label found, define a macro in place for the actual perfdata-label:
$host_name_template$.perfdata.$perfdata_label$.value
I would like to do the opposite. For checks where the performance data isn’t labelled with specific names i can do explicit mappings to show them into a single graph:
[connection_count.graph]
check_command = "connections"

[connection_count.metrics_filters]
closed.value = "$service_name_template$.perfdata.CLOSED.value"
close_wait.value = "$service_name_template$.perfdata.CLOSE_WAIT.value"
closing.value = "$service_name_template$.perfdata.CLOSING.value"
established.value = "$service_name_template$.perfdata.ESTABLISHED.value"
fin_wait1.value = "$service_name_template$.perfdata.FIN_WAIT1.value"
fin_wait2.value = "$service_name_template$.perfdata.FIN_WAIT2.value"
last_ack.value = "$service_name_template$.perfdata.LAST_ACK.value"
listen.value = "$service_name_template$.perfdata.LISTEN.value"
syn_recv.value = "$service_name_template$.perfdata.SYN_RECV.value"
syn_sent.value = "$service_name_template$.perfdata.SYN_SENT.value"
time_wait.value = "$service_name_template$.perfdata.TIME_WAIT.value"
connections.value = "$service_name_template$.perfdata.connections.value"

[connection_count.urlparams]
areaAlpha = "0.5"
min = "0"
yUnitSystem = "none"
lineWidth = "2"
hideLegend = "false"

[connection_count.functions]
closed.value = "alias(color($metric$, '#00007f'), 'CLOSED')"
close_wait.value = "alias(color($metric$, '#55aa0'), 'CLOSE_WAIT')"
closing.value = "alias(color($metric$, '#ff0000'), 'CLOSING')"
established.value = "alias(color($metric$, '#aa007f'), 'ESTABLISHED')"
fin_wait1.value = "alias(color($metric$, '#aa5500'), 'FIN_WAIT1')"
fin_wait2.value = "alias(color($metric$, '#ffaa7f'), 'FIN_WAIT2')"
last_ack.value = "alias(color($metric$, '#00ffff'), 'LAST_ACK')"
listen.value = "alias(color($metric$, '#737373'), 'LISTEN')"
syn_recv.value = "alias(color($metric$, '#ff00ff'), 'SYN_RECV')"
time_wait.value = "alias(color($metric$, '#ff69b4'), 'TIME_WAIT')"
connections.value = "alias(color($metric$, '#ecd540'), 'CONNECTIONS')"
However this does not work if i have a list of different labels like sda,sdb,sdc and so on;
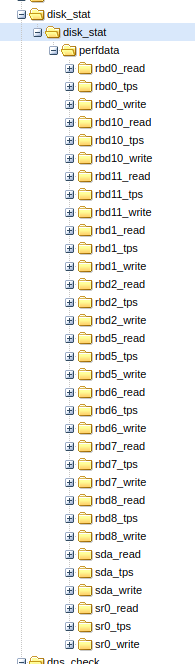
If i use an asterisk there, still graphs are shown for each device and not a single one with all. Also read Functions — Graphite 1.2.0 documentation but didn’t get the right idea.
Can somebody help me trying to understand how i could accomplish my target?
Regards