Description
Hi all,
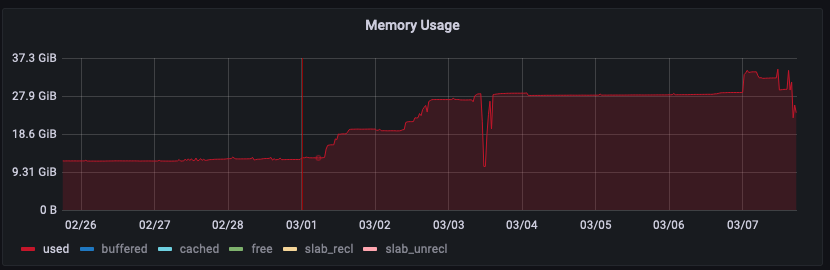
The memory usage of our primary Icinga2 instance has increased significantly since the beginning of this month. We’re running it HA with 2 master nodes.
The icinga2 process on the primary master is using 18G of memory. The secondary is only using 3,5G. Digging in deeper, I suspect that it might be the high amount of downtime objects causing this, since this seems really high: 421,799
Now I’m trying to clean those up. I reduced the retention period in IcingaDB from 365 to 90 days. This looked promising after it ran the cleanup:
retention: Removed 636977 old downtime history items
However, after restarting Icinga it still showed me 421k downtime objects instantiated:
information/ConfigItem: Instantiated 421915 Downtimes
It seems like they are still present somewhere. How can I clean this up?
DB:
MariaDB [icingadb-prod]> select count(*) from downtime_history;
+----------+
| count(*) |
+----------+
|   911381 |
+----------+
1 row in set (0.27 sec)

MariaDB [icingadb-prod]> select count(*) from downtime;
+----------+
| count(*) |
+----------+
|      557 |
+----------+
1 row in set (0.00 sec)
System version & info
Icinga2 - version: r2.13.6-1

System information:
  Platform: CentOS Linux
  Platform version: 7 (Core)
  Kernel: Linux
  Kernel version: 3.10.0-1127.18.2.el7.x86_64
  Architecture: x86_64
 $ sudo icinga2 feature list
Disabled features: compatlog debuglog elasticsearch gelf graphite ido-mysql influxdb influxdb2 opentsdb perfdata statusdata syslog
Enabled features: api checker command icingadb livestatus mainlog notification
Instantiated 1 NotificationComponent.
Instantiated 1 LivestatusListener.
Instantiated 1 ExternalCommandListener.
Instantiated 1 CheckerComponent.
Instantiated 4 TimePeriods.
Instantiated 2 Users.
Instantiated 84430 Services.
Instantiated 75474 ScheduledDowntimes.
Instantiated 2 Zones.
Instantiated 4 NotificationCommands.
Instantiated 162678 Notifications.
Instantiated 2977 Hosts.
Instantiated 1 IcingaApplication.
Instantiated 18 HostGroups.
Instantiated 84430 Dependencies.
Instantiated 300 Comments.
Instantiated 10 EventCommands.
Instantiated 421799 Downtimes.
Instantiated 2 Endpoints.
Instantiated 1 FileLogger.
Instantiated 12 ApiUsers.
Instantiated 253 CheckCommands.
Instantiated 1 ApiListener.
Instantiated 1 IcingaDB.