Hi!
I’m trying to use the check_prometheus_metric as described here:
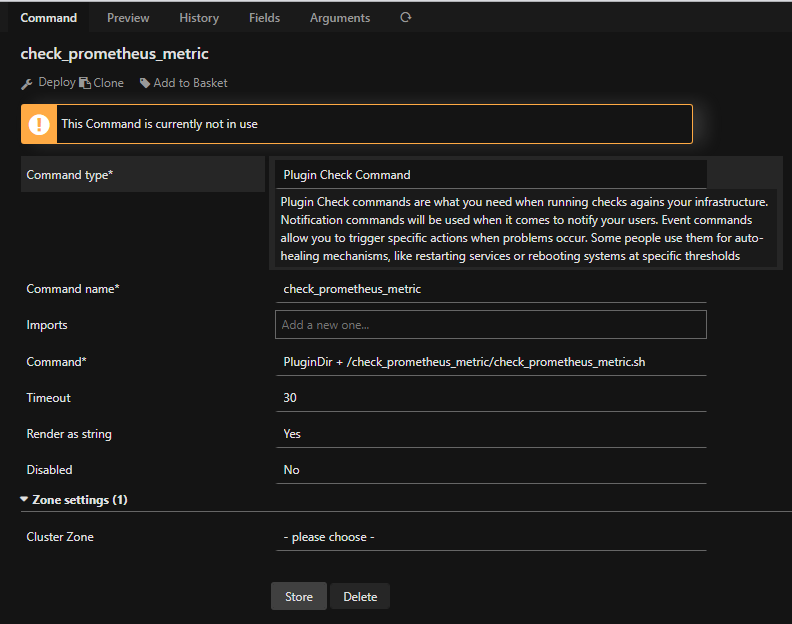
I have created ALL the VARIABLEs and upload the plugin “check_prometheus_metric.sh” into a custom folder "PluginDir + “/check_prometheus_metric/”
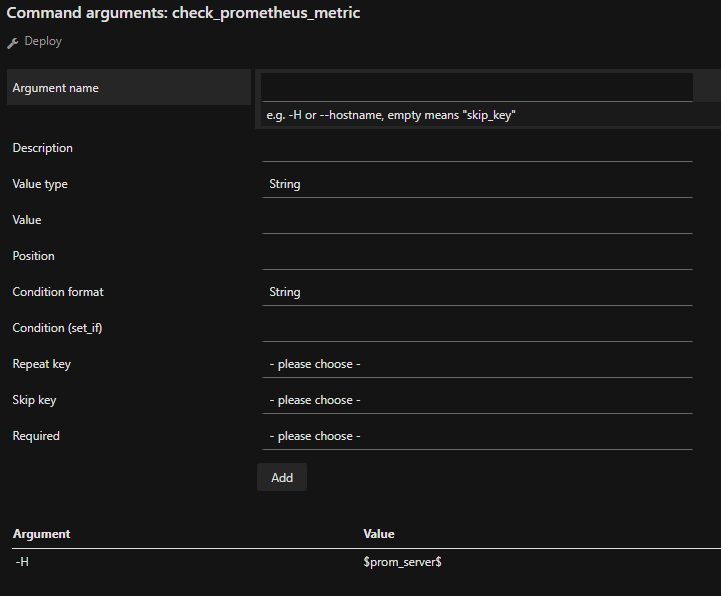
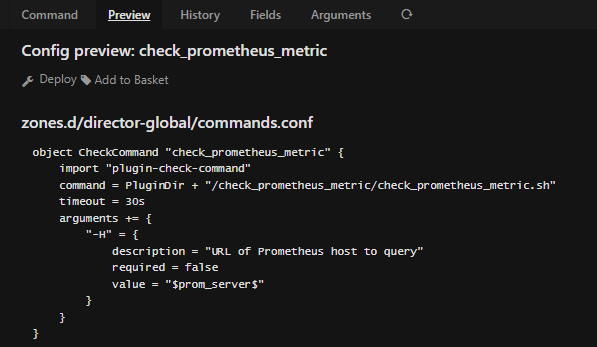
When I start to create the COMMAND - With DIRECTOR - I’m start to have problem when I ADD the ARGOMENTS to the command.
I I deploy the cummand (simple with no Arguments) It will be deployed correctly.
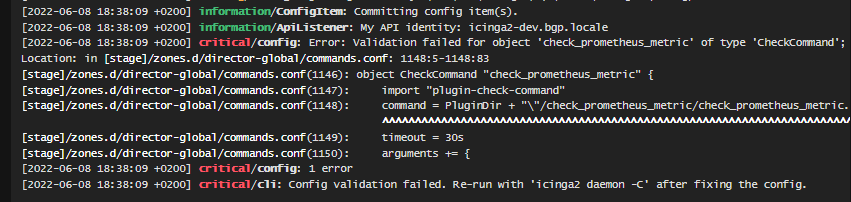
When I add the first Arguments (that is -H) - The deploy finish with this error:
Give as much information as you can, e.g.
-
Version used :The Icinga 2 network monitoring daemon (version: r2.13.3-1)
-
Operating System and version: UBUNTU 18.04.6 LTS
-
Enabled features:
Disabled features: command compatlog debuglog elasticsearch gelf graphite icingadb influxdb2 livestatus opentsdb perfdata statusdata syslog
Enabled features: api checker ido-mysql influxdb mainlog notification -
Icinga Web 2 version and modules (System - About): Icinga Web 2 Version 2.10.1