Hi,
I’m struggling to scale out check_nwc_health for pulling back switch interface usage, errors, and duplex, on 48 port switches.
I’ve deployed a satellite node to offload checks from my Master, however I’m running into issues with cpu load.
My checks appear to work without issue and are as follows;
The frequency for each is, note I have made these values longer trying to improve performance;
Usage:120s
Duplex:1200s
Errors: 24000s
The Timeout on all 3 is 20s.
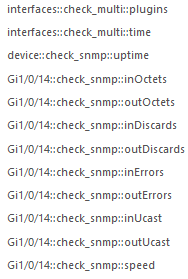
My host is configured with an array for each interface, approximately 48 per switch.
When I start Icinga or redeploy I see situations where hundreds of processes are created and the whole thing grinds to a halt. I suffer timeouts and things seem to backup I’ve tested the command line against each switch and they respond instantly.
My satellite is running 2 cores with 4GB, on a VM,
I’ve now increased the resources on the satellite VM to 4 cores and 12GB, it’s certainly helped, but seems a little excessive. I’d be interested to know if there is a better way of achieving the same result.
I’ve also got a switch with over a hundred interfaces, when using check_nwc_health to query int usages and duplex, my box grinds to a halt. Throwing excessive cpu and ram at the problem is great and we can’t really spare it either. Is there a better option?
what you describe is like “work as design” and how Icinga, the check_nwc_health script, interpreter languages etc. works.
First of all if you look into the script you will see it’s a perl script with 77391 lines. A lot of!
Depending how many switches you want to check you fire this script with this many lines against the switches - 3 times! (for every mode one time).So not very efficient on large environments.
if icinga triggers the start of the check parallel - maybe after a (re)start of the daemon - there will be a lot of processes in the task manager.
Simplified calculation to make this clear:
In our setup the script needs 0,2 % from memory and 3,6% cpu, the execution time is about 0,3 to 1 sec (depending on switch and what to check) - not much if you read this. But let’s say you have 1000 switches to check and you want the script with 3 diffrent modes like in your example. 0,2 %mem x 1000 switches x 3 modes = 600 % memory. Ok I know this calculation is not 100% correct, because there are some more influences than this simple calculation, like a delay for running the processes, but it should show you how many ressources the checks need. In this thread of stackexchange.com I found this command:
With this command I see that if perl excute the script and has to load a lot of modules it need about 212092K to check the cpu-load on our switches!
You can observe this if you stop the icinga daemon, start a second shell with a task manager like (h)top, wait and start the daemon again. You will see in the task manager how many proccesses icinga has to start and the cpu load and memory of your server is rising. Similar behavior after after a deployment or if you have to restart your icinga server. Here did the devs a good job so icinga has some mechanism inside, that icinga know what is to check now. (see Technical Concepts - Icinga 2 or Technical Concepts - Icinga 2) .
What can you do?
Create a wrapper script to add another artificial delay, like
cluster your satellites so that the load is shared a little. In addition, you get a reliability.
Use another check which saves resources. Instead of check_nwc for interfaces we for example are using this one: Icinga Template Library - Icinga 2, You can get the check from here https://github.com/NETWAYS/check_interfaces. It’s a C program. And it’s much faster. e.g. in our setup this program needs 0.7 % cpu and 0.0%mem and the execution time is about 0:00:03 sec
Thanks for the detail. You’re input is certainly aligned with my experience. I’d prefer to go with the simpler solution, as it should be easier for others to maintain long term. I’m therefore going to look at the check interfaces option.
Yes and no. We use “check_nwc_health” and/or “check_interfaces” to check the interfaces from our switches.
it is how Icinga works:
Icinga triggers the checks (scripts). The return value of the used script is in the case of the mentioned scripts besides up/down also performance data. They will be shipped into Grafana.
Like every other used check (script)
Since the check_nwc_health plugin is written in perl and perl is an interpreter language, the perl interpreter is executed every time the plugin is run which causes a lot of CPU and IO.
We had the same problem in our setup with many network devices.
There is a newer project called “Thola” which is written in Go, is very fast and requires few system resources.
I’m very excited to try this we monitor ~3,000 network devices at ~80 sites and we’ve had to significantly increase the resources allocated to our satellites since using check_nwc_health for interface monitoring.
Here the same, we will try the new check the next time. We have also a lot of network devices to check and the mix from check_interfaces and check_nwc_health makes some troubles at some locations and hardware types
I am interested in your feedback. If something is still missing or not working, it’s best to open an issue on GitHub.
It may well be that vendors / models are missing. But these can be added independently via YAML config file: Writing a device class | Thola Documentation
Please upload the YAML config files via PullRequest on GitHub.
Alternatively, you can also provide an SNMP record file and we add the device.
I’ve had a chance to test this evening and so far it looks great, and we will definitely make use of the features.
One of the reasons we make use of the check_nwc_health plugin is it has the cability to calculate interface saturation as a percentage.
Although we are writing our perfdata to InfluxDB and OpenTSDB (and we can graph utilisation from there), it is still useful for us to have the check exit with Warning or Critical when an interface becomes fully saturated.
I believe check_nwc_health does this by storing the previous values in a temporary file, and calculating the delta, and dividing by the time between the checks.
Is this something you would likely look at implementing? I understand that it may be compute intensive to do all of those calculations, hence the reason why check_nwc_health is so heavy on resources.
 we monitor ~3,000 network devices at ~80 sites and we’ve had to significantly increase the resources allocated to our satellites since using check_nwc_health for interface monitoring.