I’ve got a icinga2 server running with an agent installed on Microsoft Windows using the icinga2 setup.
I’m using check_ncsp_api from the satellite to run check_cpu or run check_drivesize on the Microsoft Windows host, but for some reason the nsclient / icinga2 client does not seem to return performance data.
Grafana is also reporting there’s no performance data and when running the command from the CLI I’m not receiving performance data either.
Is there any way on howto solve this? I’ve already set “performance data = true” in nsclient.ini under the npre section (which should already be on by default, as it wasn’t explicitly defined) and that didn’t help.
I’ve taken the liberty and edited your post with some newlines, allows more focussed reading.
First off, I highly recommend to run the check_nscp_api checks only local on the agent via the Icinga2 agent. NSClient++'s API is all or nothing, which allows for possible MITM attacks.
Second, please share the configuration done there, and especially the executed command line, and your manual CLI tests.
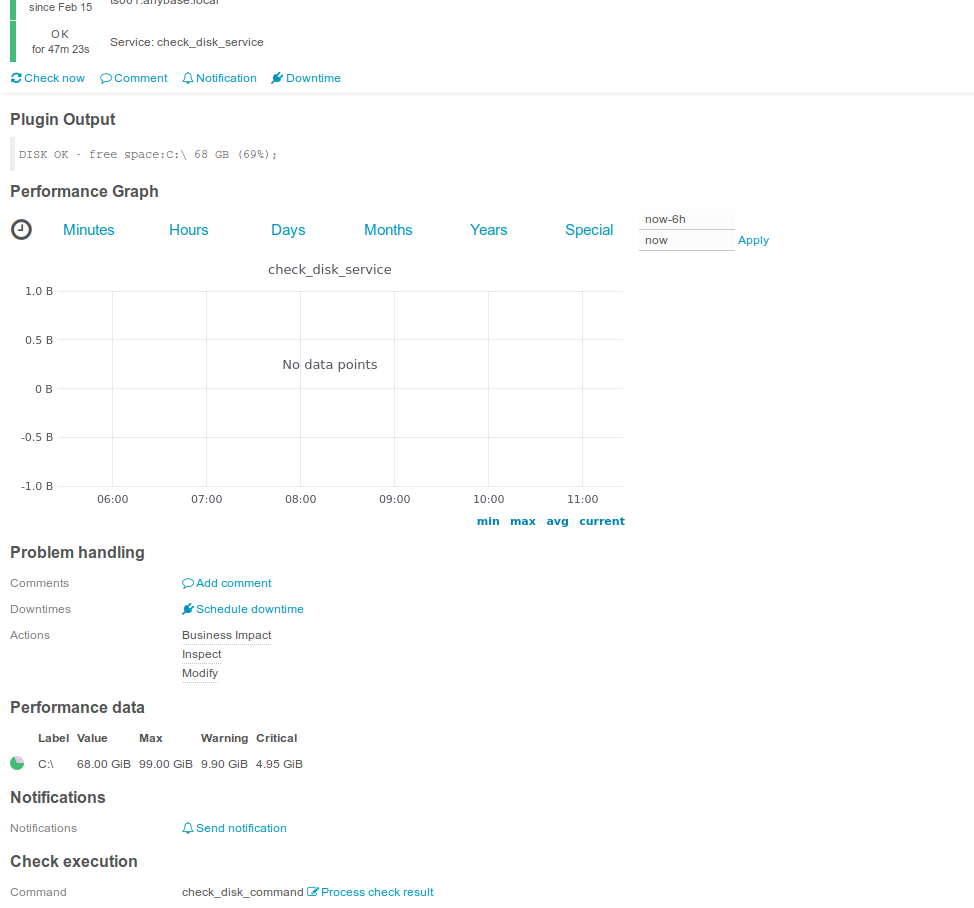
I’ve tested the scenario by executing the command from the Microsoft Windows machine and when running check_disk.exe on the Microsoft Windows machine, it is reporting performance data after the | right now.
It’s reporting the check was successful and it’s giving me back metrics. But I can’t see the performance data that I was able to see on the Microsoft Windows host for some reason
So it has performance metrics in the output, but the data is not processed by your chosen metric writer.
Since you’re referring to Grafana, please share the datasource type, and enabled icinga2 features. Inspect the icinga2.log wether the metrics are parsed correctly, respective the metric writer’s log if there are any specific errors.
Upon further investigation I’ve found out that it’s logging performance data in the InfluxDB database, but it’s just not being displayed in a graph for some reason.
Enabled features: api checker ido-mysql influxdb mainlog notification perfdata
The output seems to be parsed correctly, as it’s registered in InfluxDB. Couldn’t find anything in the icinga2.log file.
EDIT: To be more precise: Grafana is telling me there’s no data points for this graph. The strange thing is that it’s working fine for hostalive. Is there anything I need to adjust in the query perhaps?
It seems to go wrong in the base-metrics template. When I adjust the query to statically use the check_disk_command, I’m getting results immediately, when I switch this to the $service$ variable however I’m not getting results at all. What could I be doing wrong?
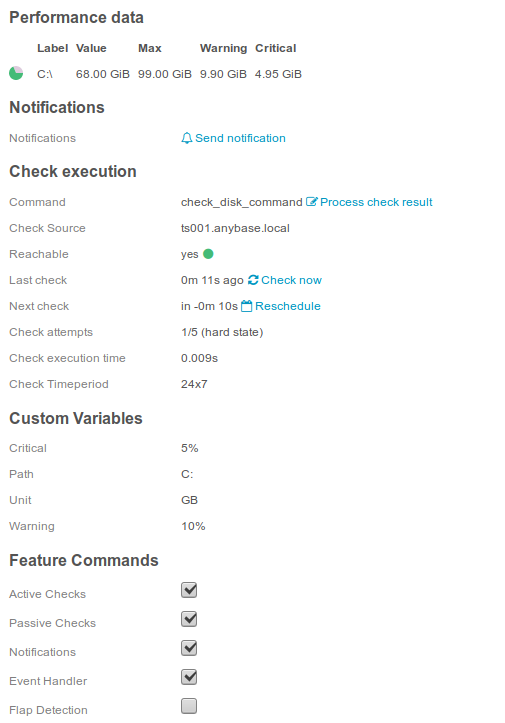
Upon further investigation I’ve found that there seems to be something wrong with either my configuration or there’s some sort of bug in the grafana module. For some reason InfluxDB is referring to check_disk_command (the name for the command), but the service name is (check_disk_service) and that’s where it’s going wrong if the command name differs from the service name.
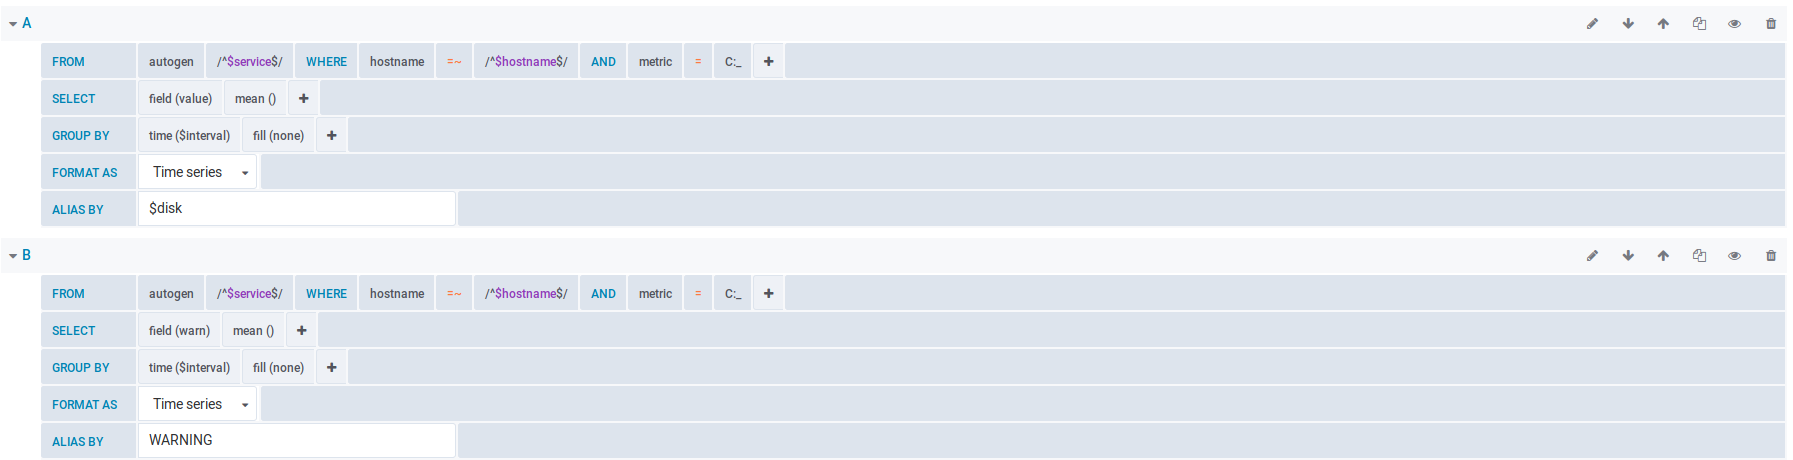
After renaming them, the graphics started working. After adapting the queries I noticed however I need to specify a metric, otherwise all services show the same graph but there’s no such variable and it’s a static query used for all services, since when I adjust it for one service, it’s adjusted for all services. How can this be solved? I also think I adjusted the query a lot. Is there anyway to get the original query back?
the module passes servicename, commandname nad hostname to grafana as variables. Icinga writes data with the command as measurement, so everything is ok. Do you use the orovided dashboards for the module or self genereted ones?
What makes me puzzling is that your influxdb stores “c:_” and not “c:”, the result text and perfdata has the correct name for the drive in your screenshot.
To help you i need the config.ini and the graphs.ini.
Thank you for your response and apologies for my late response, but I’ve solved it by adding the custom variable C:_ to the Icinga graphs and it’s displaying properly now.

 but there’s no such variable and it’s a static query used for all services, since when I adjust it for one service, it’s adjusted for all services. How can this be solved? I also think I adjusted the query a lot. Is there anyway to get the original query back?