Check memory-windows show_used

Hi!
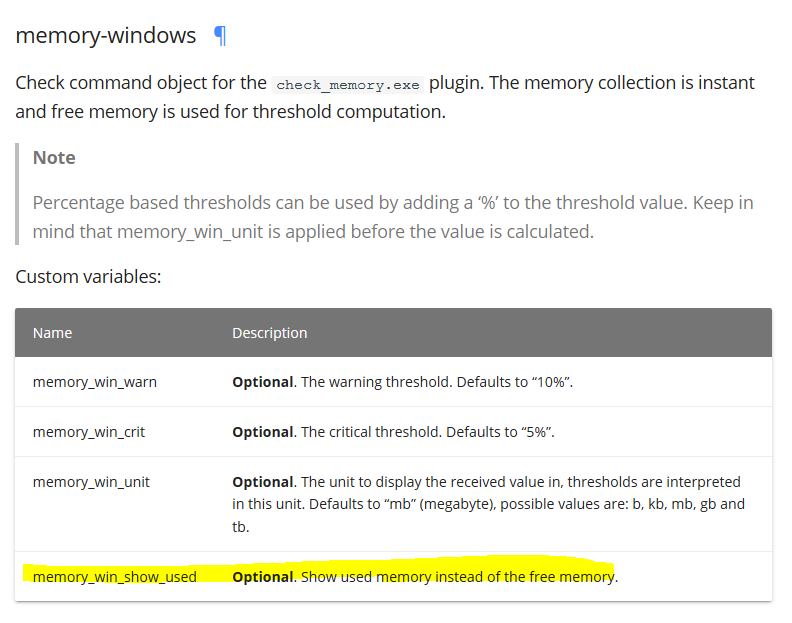
I would like to ask you if someone successfully uses the memory-windows plugin with the “memory_win_show_used” variable.
It doesn’t work for me:
image
My service rule in global-templates looks like that:

apply Service "RAM" {
  import "generic-service"
  check_command = "memory-windows"
  command_endpoint = host.name
  vars.memory_win_warn = "10%"
  vars.memory_win_crit = "5%"
  vars.memory_win_show_used = true
  assign where host.vars.os == "Windows"
}

Thank you!

1 Like

Hi,

the value didn’t drop below 10% yet as warning threshold. An oversight?

Cheers,
Michael

That’s correct. At the moment, the free space is monitored.
But I thought if it’s possible to monitor the used mem instead of the free mem.
The system total ram is 8GB and 7GB are used.
The value should show something like 7.00 GiB (=used mem)
At the moment, it shows the free mem (~1.00GiB)

So that used mem is used for threshold computation.

Ah, show_used. Now I get it, sorry. I don’t know how the plugin is implemented, I needed to look into the code. From what I can see there, the option should also change the output from free to used.

For some reason, memory_win_show_used is not applied - can you please extract the executed command line from the plugin call?

In terms of future developments in this regard, I strongly recommend to test the new Icinga for Windows framework developed by @cstein - https://icinga.com/2019/11/05/icinga-for-windows-rc-available/

Cheers,
Michael

Hi Michael,
just to make sure:
You want me to create a .sh executable file with that content:

ICINGA2_API_PASSWORD=icinga icinga2 console --connect ‘https://root@localhost:5665/
–eval ‘get_service(“example.localdomain”, “http”).last_check_result.command’ | python -m json.tool

[
“/usr/local/sbin/check_http”,
“-I”,
“127.0.0.1”,
“-u”,
“/”
]

and post the output?

If yes, my file should look like that:

ICINGA2_API_PASSWORD=myapipassword icinga2 console --connect ‘https://root@ip_of_icinga_master:5665/’
–eval ‘get_service(“name_of_endpoint”, “disk-windows”).last_check_result.command’ | python -m json.tool

Is that correct?

But what about that:
[
“/usr/local/sbin/check_http”, ?
“-I”,
“127.0.0.1”, ?
“-u”,
“/”
]

Thank you!

PS: I found out that the same problem exists with the disk-windows plugin. There is exactly the same variable, but doesn’t work either.

Hi Michael,
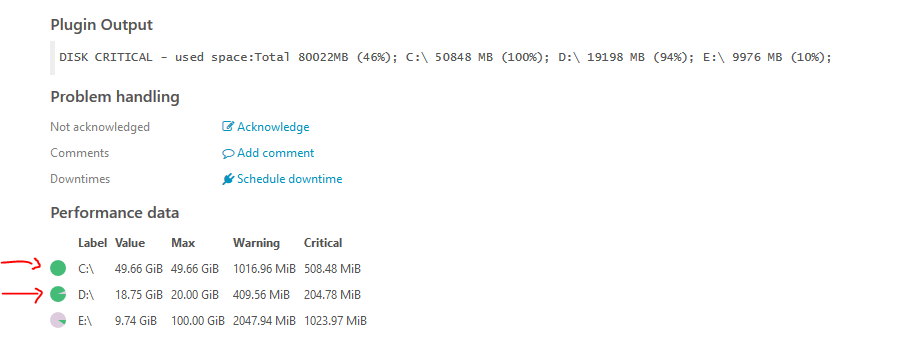
I don’t know why, but the plugin now shows the used disk space.
But the circles in front of the disks are green, but they should be red or orange, I think:


Because the disk is full, not free.
Do you think that can be changed?

Those graphs are rendered by the utility helpers of Icinga Web. Dunno whether their coloring can be changed. Afaik they only change colors whenever a warn/crit threshold is hit.

But it’s hitting a crit threshold:

The mentioned circles are just pie charts to present the fill level as graphic. They doen’t change their color in case of warning or critical level are exceeded.

okay!
Do you know if it’s possible to change that color? It’s always confusing because green normally means free space. But in that case it’s used space.
So a orange color for example would be more appropriate

No, I don’t know. I’m sorry.