Hi,
if I execute a check plugin via commandline, the execution time is below 1 second.
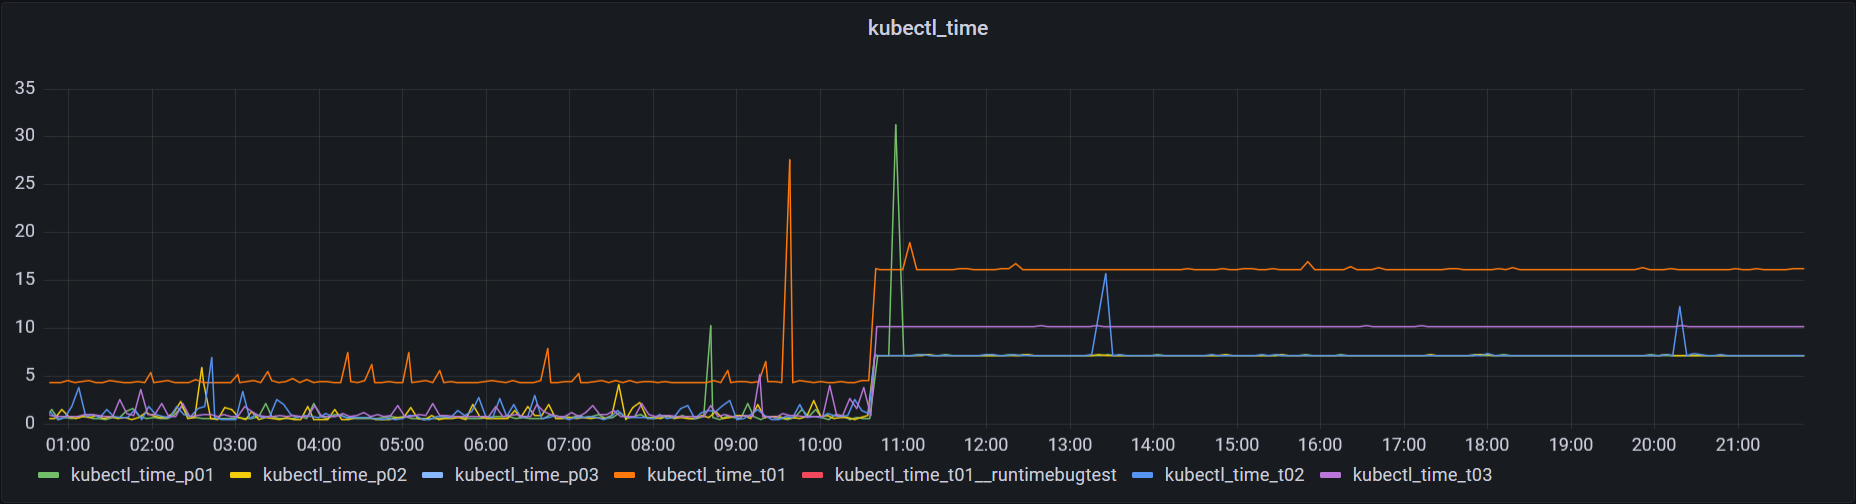
If icinga executes the same command it runs constantly 10 seconds.
The check is executed local on the icinga server and used to measure how fast a connection to a kubernetes cluster. It executes an kubectl describe namespace.
When I first established the service this problem didn’t occurred. Over the time I added some other services which use the same plugin but to another targets. Then something happened and on all these services have the same problem but with slightly different but higher execution times as execution via commandline.
It looks like the execution via icinga stuck somewhere, but I’m not able to find out where.
My initial check plugin was written in bash. After the problem occurred, I wrote a new one which does the same in python. But the problem is still the same.
- Version used (
icinga2 --version)
r2.13.2-1 - Operating System and version
Debian 11 - Enabled features (
icinga2 feature list)
Disabled features: command compatlog debuglog gelf graphite influxdb2 livestatus opentsdb perfdata statusdata syslog
Enabled features: api checker ido-mysql influxdb mainlog notification
I hope you can help me to find new ideas what could cause the problem.
Kind regards
Steffen