Hello.
My test Icinga2 environment uses the following Docker images:
- icingadb:1.1.0
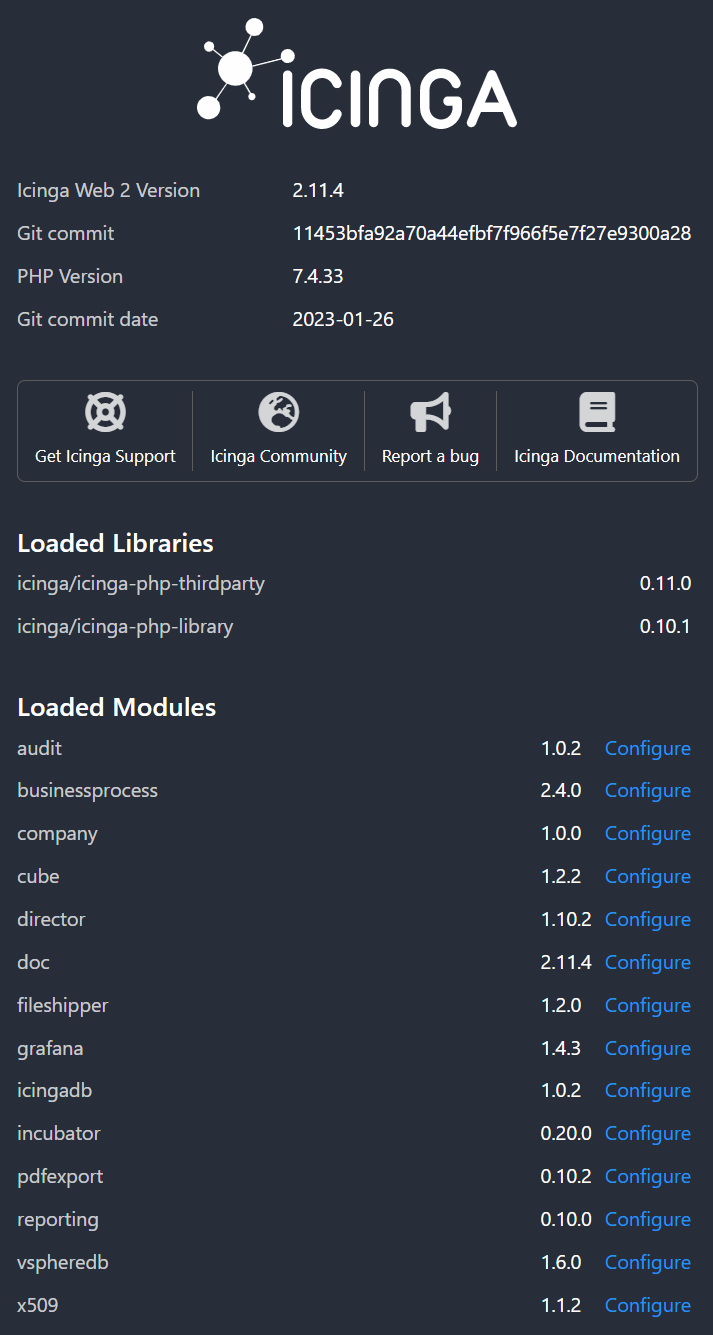
- icingaweb2:2.11.4
- icinga2:2.13.6
- icingadbredis:7.0.4
- influxdb2:2.6.1
- grafana:9.1.5
Configuration details:
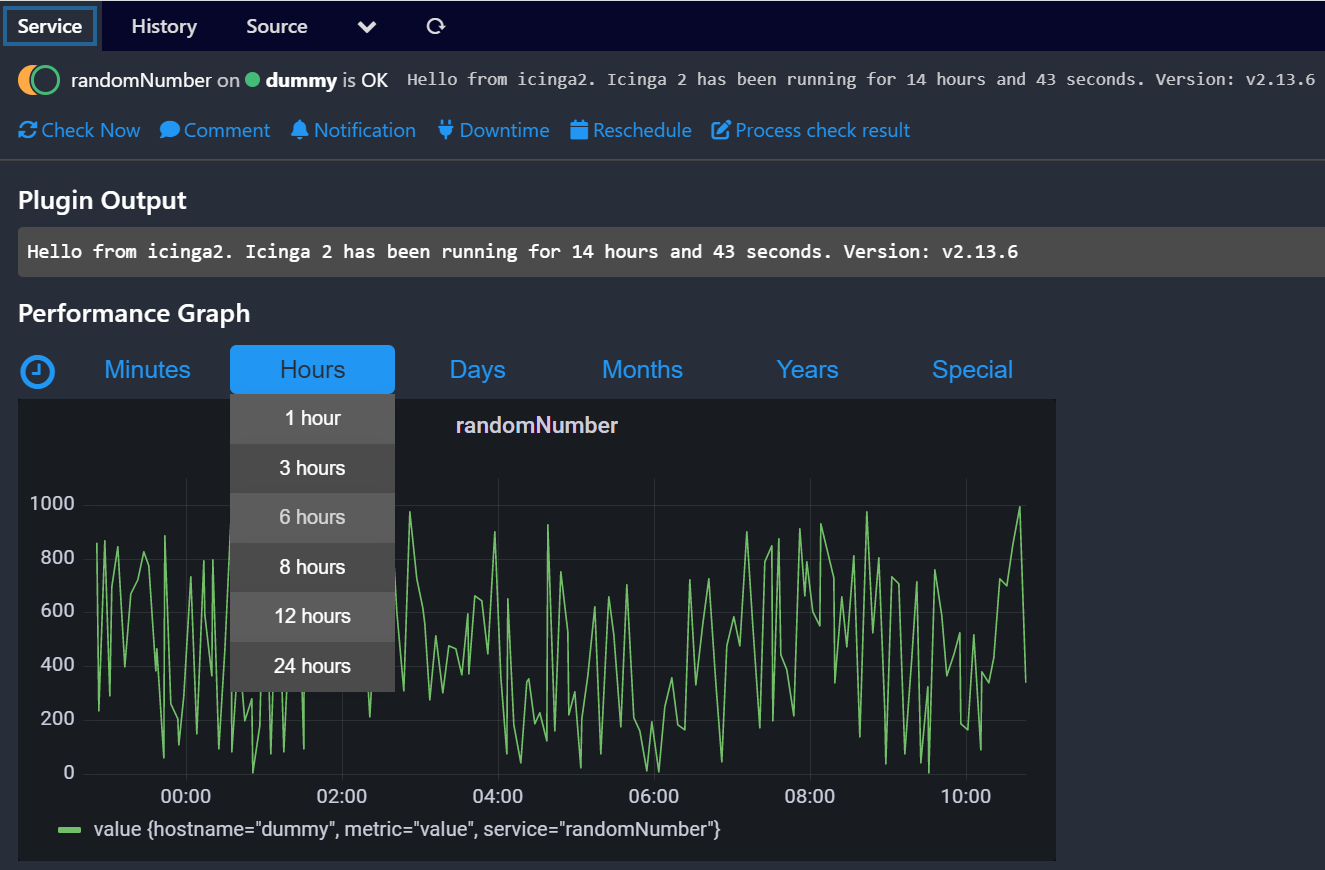
After setting up the integration with Grafana, I get a performance graph as below:
(1) “http://testhost:8080/icingadb/services#!/icingadb/service?name=randomNumber&host.name=dummy”

When I try to change the time range for the performance graph (e.g. for 3 hours):
I get the following error:
(2) “http://testhost:8080/icingadb/services#!/monitoring/service/show?host=dummy&service=randomNumber&timerange=3h”
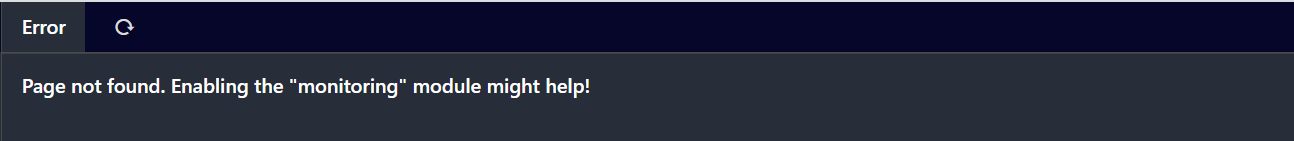
Since I am using IcingaDB the Monitoring module is disabled.
But when I modify the working URL (1) by adding the &timerange=3h argument, everything works fine
(3) “http://testhost:8080/icingadb/services#!/icingadb/service?name=randomNumber&host.name=dummy&timerange=3h”
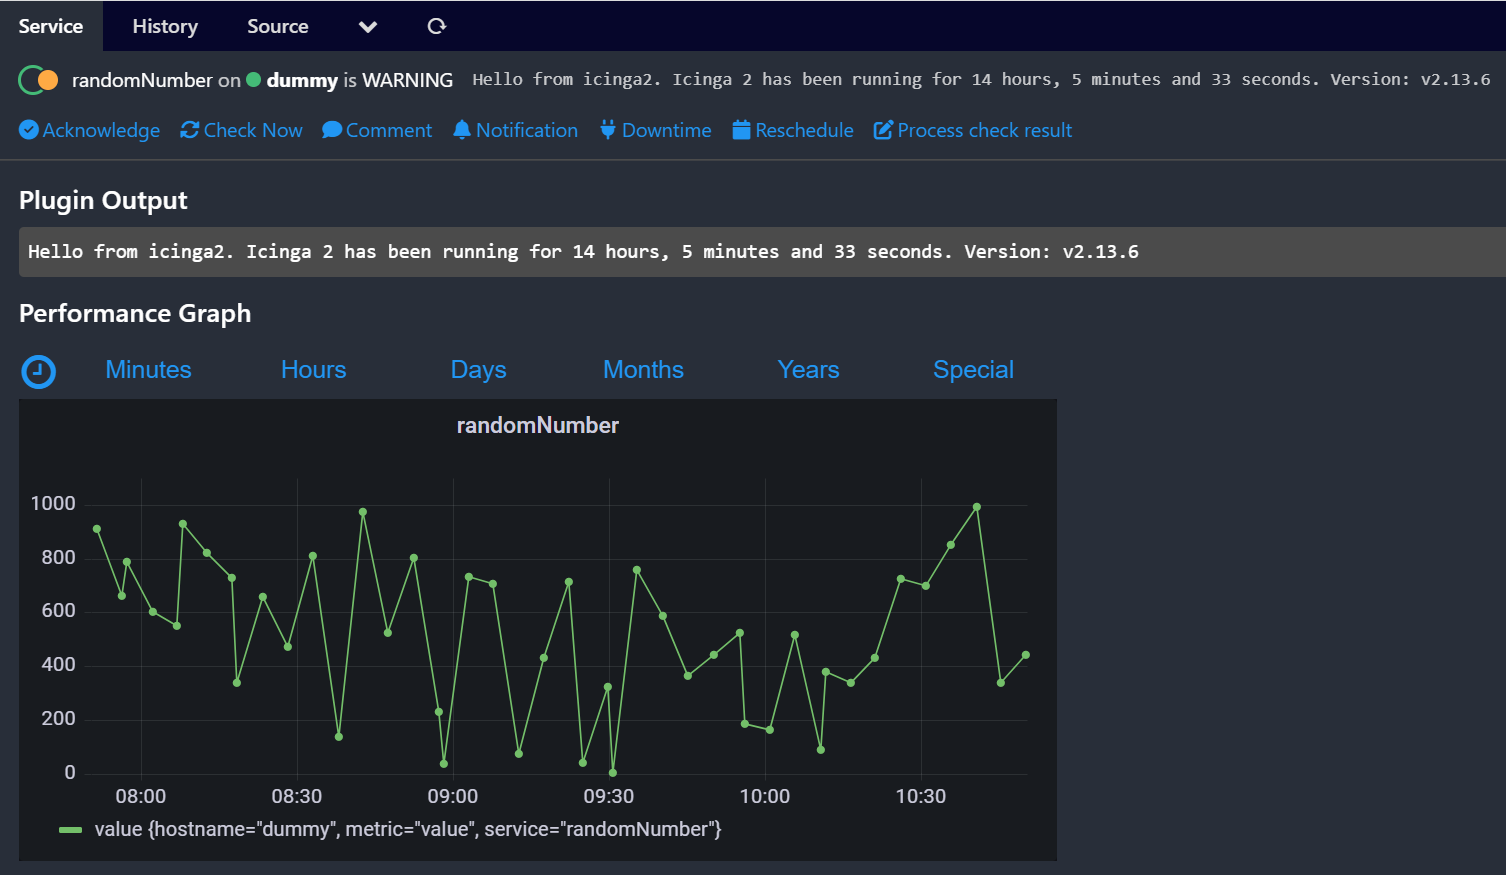
My conclusion is that changing a time range for the performance graph generates the invalid url (2) with ‘monitoring’ word in it. My question is how to fix it to use in production environment?
Best regards.
JK