-
Icinga Web 2 version
2.11.2-1.bullseye -
Used modules and their versions (System - About)
doc 2.11.2
grafana 1.4.2
monitoring 2.11.2 -
Web browser used
Firefox 106.0.5 -
Icinga 2 version used (
icinga2 --version)
2.13.6-1+debian11 (r2.13.6-1) -
PHP version used (
php --version)
PHP 8.1.12 or 7.4.30-1 -
Server operating system and version
Debian bookworm (testing) (Yes, I used sid before but I’m now waiting for bookworm to be stable.)
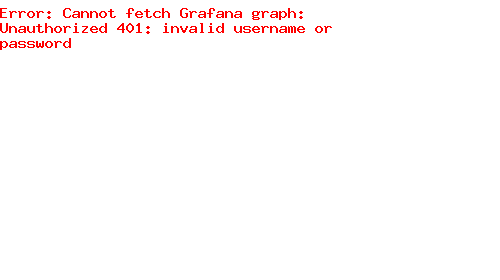
I’m using Grafana with Graphite.
Suddenly (today) I got ‘Unauthorized’ (See attached image) on all
graphs within icinga. If I click on them I get the normal
Grafana page with the current graph.
So something happens when icingaweb tries to render the graph.
This has been working for many months without a problem.
I have icinga->apache_proxy->carbonapi->go-carbon so it isn’t obvious
which part is suddenly rejecting me.
My question is mostly, what component would generate the text?
It seems to be before grafana so I assume it is somewhere in icingaweb?