Hi,
I am wondering whether there is any documentation how to actually USE icinga web 2. The documentation on the web page is essentially the same that can be obtained by installing the doc module, and is has important information for the administrator and explains how to set up authentication and authorization, the database backend etc.
But as a user of icinga web 2, I don’t find anything.
That being said, I for example am a but underwhelmed by the tactical overview of icinga web 2 , as it only shows hosts and services and how many of them are in which state. In a regular state, icinga’s classic web UI shows a lot of zeroes, but one can be sure that those values are actually displayed. I have yet to see a major outage with my icinga 2 installation, and I surely hope that I will get all those numbers in icinga web 2’s tactical overview once they’re non-zero.
And, the old tactical overview also alerts me when checks, event handlers and/or notifications are disabled and hosts are flapping.
I have not yet found a way to display different parts of the icinga web 2 interface (is that what you’re calling “dashlets”?) at he same time. My Icinga 2 dashboard hast four tabs called “Current Incidents”, “Overdue”, “Muted”, and one I created called “mine” (with the tactical overview). All four tabs display a lot of white, but I haven’t found a way to display them simultaneously.
I must be doing something terrible wrong, but with what I have currently have I will cry bitter tears when the classic web UI will stop working in the future.
Can you help?
Greetings
Marc
P.S.: This article was written at Feu’s request on twitter after I mentioned there that I can’t get a solid grip on icinga web 2 at the moment. Thanks to all for the great work on icinga 2 and to Feu for the excellent social media presence
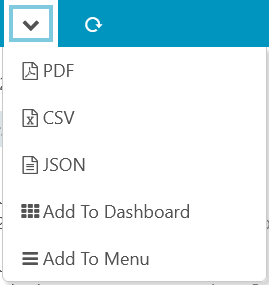
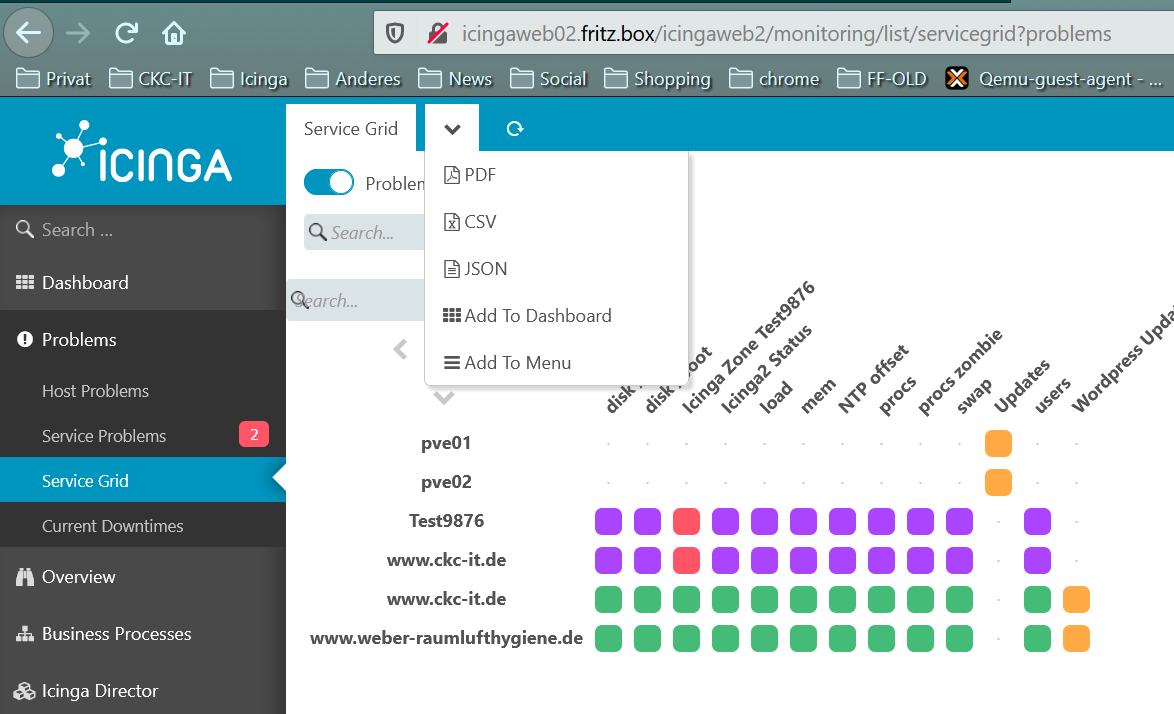
 It opens a page where you can choos to add this dashlet to existing or new dashboards.