Some time ago the arrangement of the graphs in icingaweb changed:
We’ve got a lot of checks with 4 to 6 graphs. By default only two are shown in default view, and there is a link below to show all graphs.
In earlier time ist expanded the view, so that all graphs are shown below. This was very useful, because all graphs share the same timeline and we could easily see, what happened in different metrics at the same time.
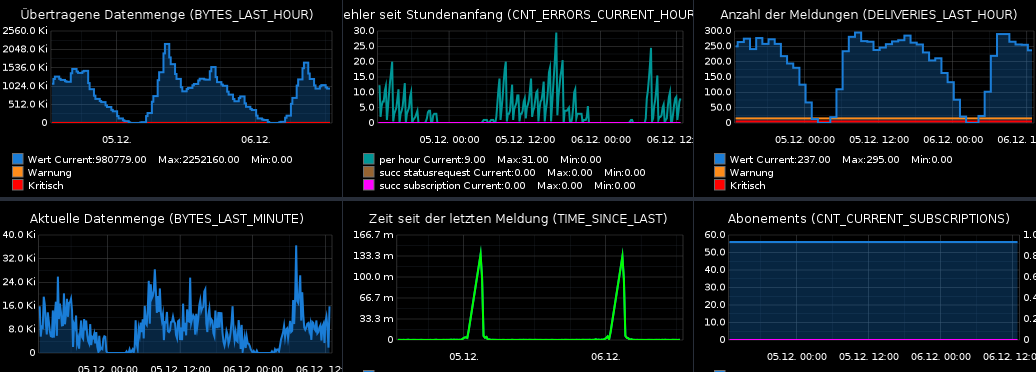
Now all graphs are loaded into a grid (2x3, 3x2, it depends on screen size). In this view it is difficult to compare different metrics at the same time, also because the time axis is much shorter:
Is there a way to get the former way back?
Regards,
Michael