Hi,
I was interested in “how often left a service the OK state per day” for a specific service. I’m not sure if this is the best solution, but I’d like to share my approach. Maybe someone finds it useful or even has an easier solution.
(There’s no performance data available and I don’t have access to the database where all these values are stored.)
The output of the Perl script was something similar to this (on day x the service left the OK state so many times):
'2019-11-01' => 1,
'2019-11-02' => 2,
'2019-11-03' => 127,
'2019-11-04' => 99,
'2019-11-05' => 1,
The previous output let me figure out very quickly the “problem days”. I’ve even imported that text into Excel and created a chart (please, don’t blame me for that  ).
).
So far the story about my aim. I’ll write about the steps I’ve done now.
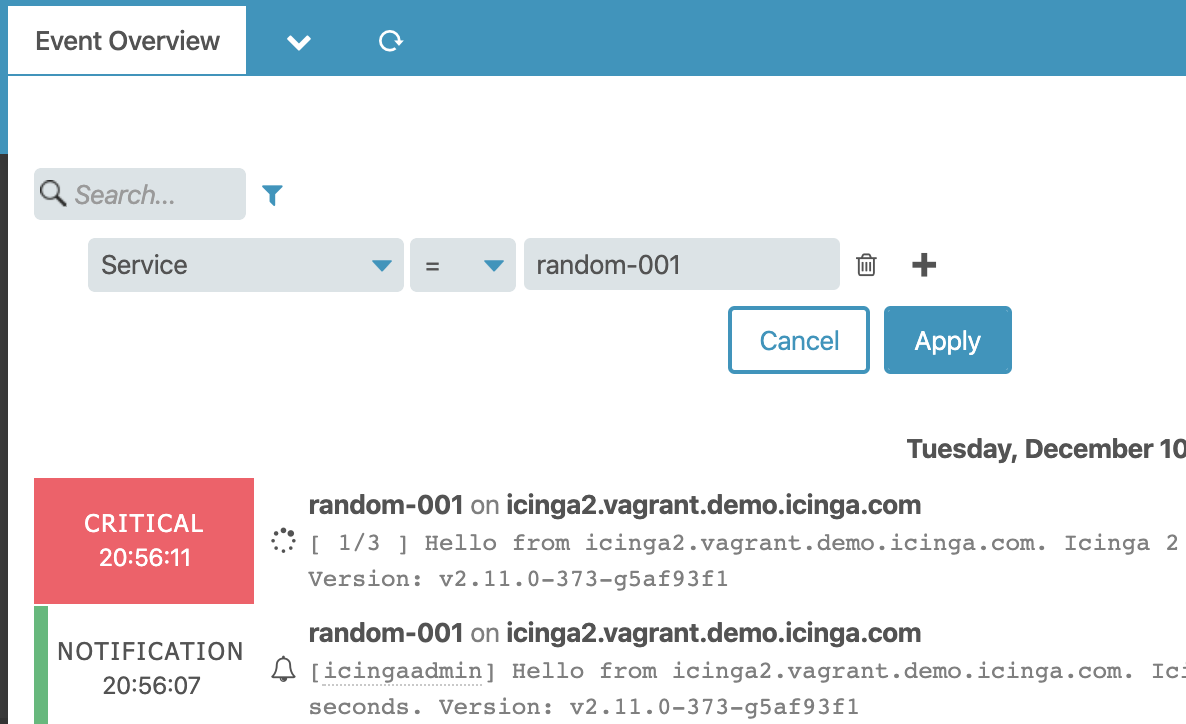
- In Icingaweb2, in History / Event Overview, I modified the filter to fit my needs.
-
Get the JSON data and save it as a file (by the way, a great feature to export data so it can easily be read by other programs)
-
Write and run a perl script. The script counts the state changes to a non-OK state and saves this information in a per-day hash (yyyy-mm-dd).
Fun with Perl
use strict;
use warnings;
use JSON;
use POSIX qw( strftime );
use Data::Dumper;

open FILE, "<", "icinga-events.json";
my $json_text = <FILE>;  # Just one line
close FILE;

my $json = decode_json $json_text;

my %errors;

foreach my $e ( @{ $json } ) {

   # Skip OK state events
   next if $e->{state} == 0;

   my $ymd = strftime "%Y-%m-%d", localtime( $e->{timestamp} );
   $errors{ $ymd }++;

}

$Data::Dumper::Sortkeys = 1;
print Dumper \%errors;
- Examine the output
Example output
This output was generated by the above mentioned Perl script. The JSON was taken from Michi’s Vagrant standalone box. Unfortunately, the box was running only on 2 days so the output is not very big but I hope you’ll get the idea.
bernd@arch ~/icinga-events-json-perl % perl icinga-events.pl
$VAR1 = {
          '2019-12-03' => 2937,
          '2019-12-10' => 244
        };
Feeding the script with different JSON files you can easily compare 2 different services for example.
I’ve thought about a heat-map similar to the Icingaweb2’s Event Grid (HTML output by the Perl script) but dismissed it.
Happy monitoring 
Bernd
