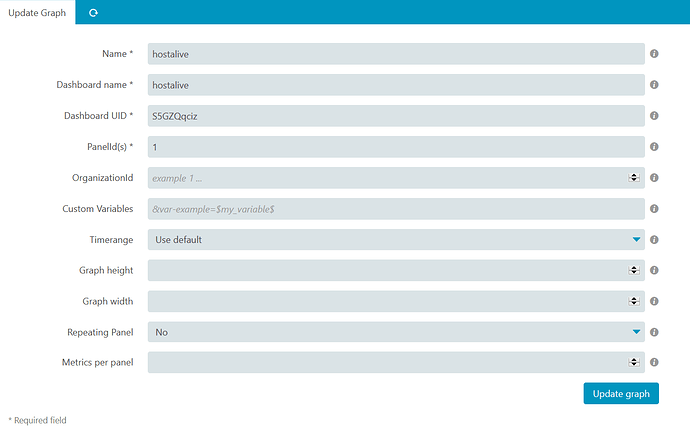
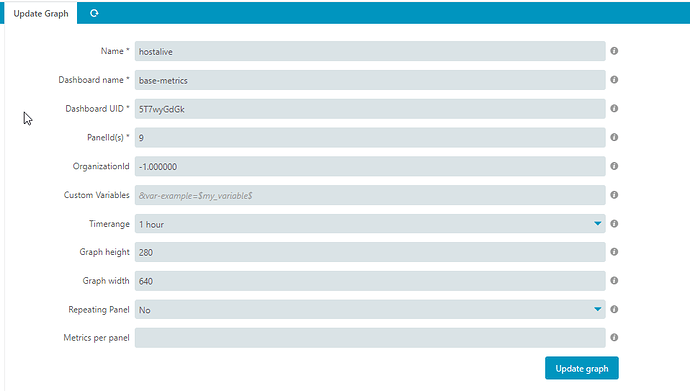
Hi,
All graphs are working just fine but the ones with hostalive (ping4, ping6) data show “no data” no matter the time interval.
What am I doing wrong ?
For the hostalive check, make sure you’re getting metric data. Try running the following in InfluxDB itself:
select * from hostalive where time >= now() - 1m
Also, can we see your host_template config from influxdb.conf?
Hi,
are the host perf data really written to influx -> take a look on the stored measurements (query schema and data)
Did you filter on metrics (rta + pl)?
Your query statement should look like this:
SELECT mean("value") FROM "autogen"."hostalive" WHERE ("metric" = 'rta' AND "hostname" =~ /^$hostname$/) AND $timeFilter GROUP BY time($interval) fill(null)
$hostname$ is a grafana variable, values will come from influxdb with SHOW TAG VALUES FROM "hostalive" WITH KEY = "hostname" -> offers a dynamic host selection for the graph.
Cheers,
Manfred
thank you  problem solved.

