Hi everyone, I want to share a project I’ve been building called IcingaAlertForge. It is a small service written in Go that acts as a oneway bridge, forwarding webhook alerts from Grafana Unified Alerting to Icinga2 as passive checks. The main goal is to keep Grafana as a flexible tool for creating alerts while using Icinga2 as the central system for presentation, tracking, and notifications.
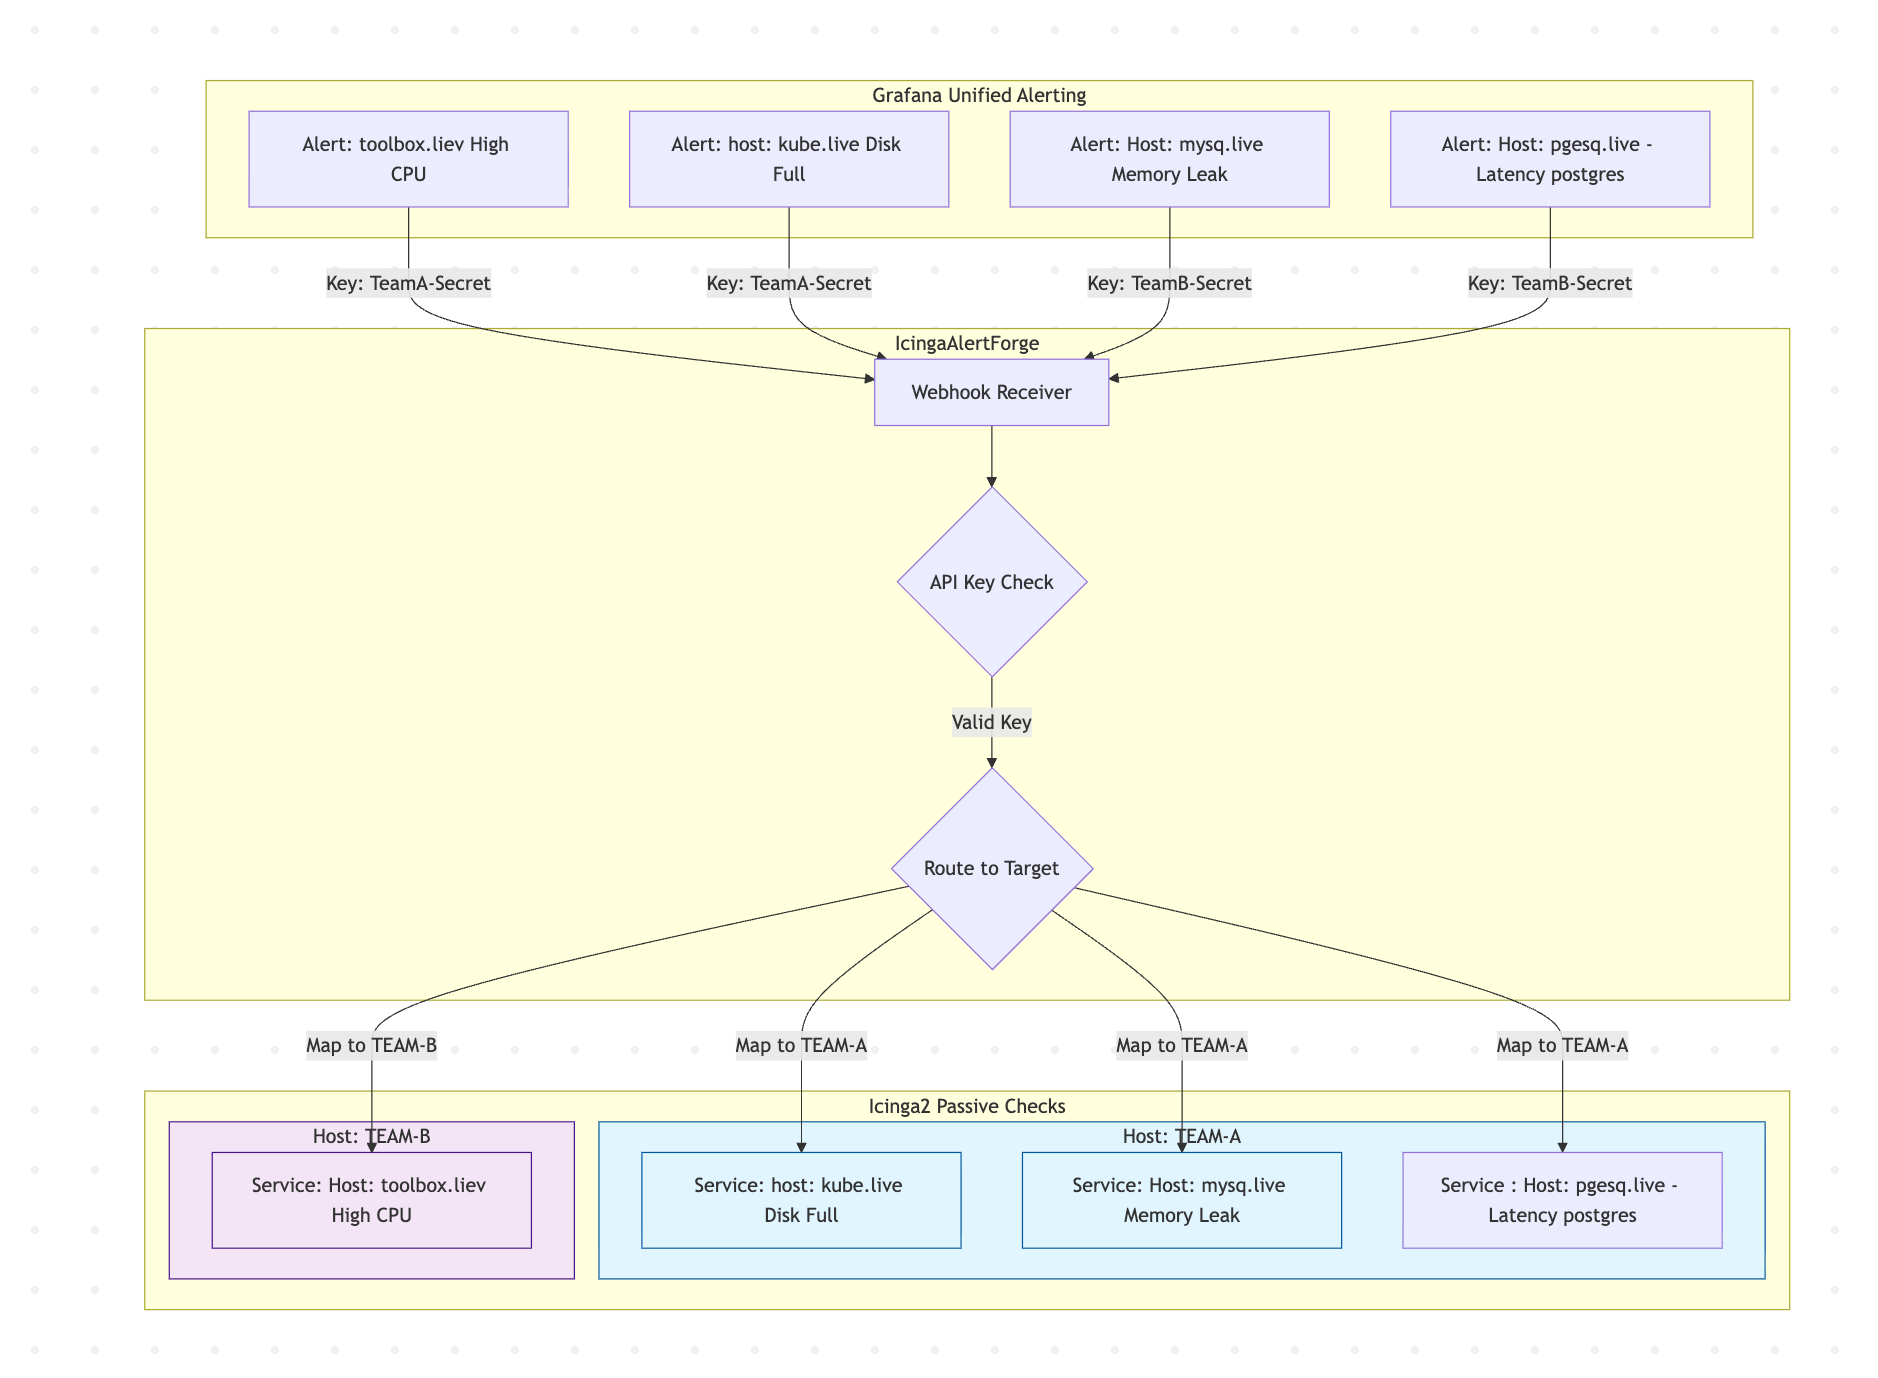
I built this because I wanted a simple way to integrate experimental or personal alerts into a professional monitoring setup without overcomplicating Icinga’s configuration. The bridge automatically creates missing dummy hosts and services in Icinga when an alert first arrives. It supports multiple teams and alert sources by routing different API keys to specific Icinga hosts.
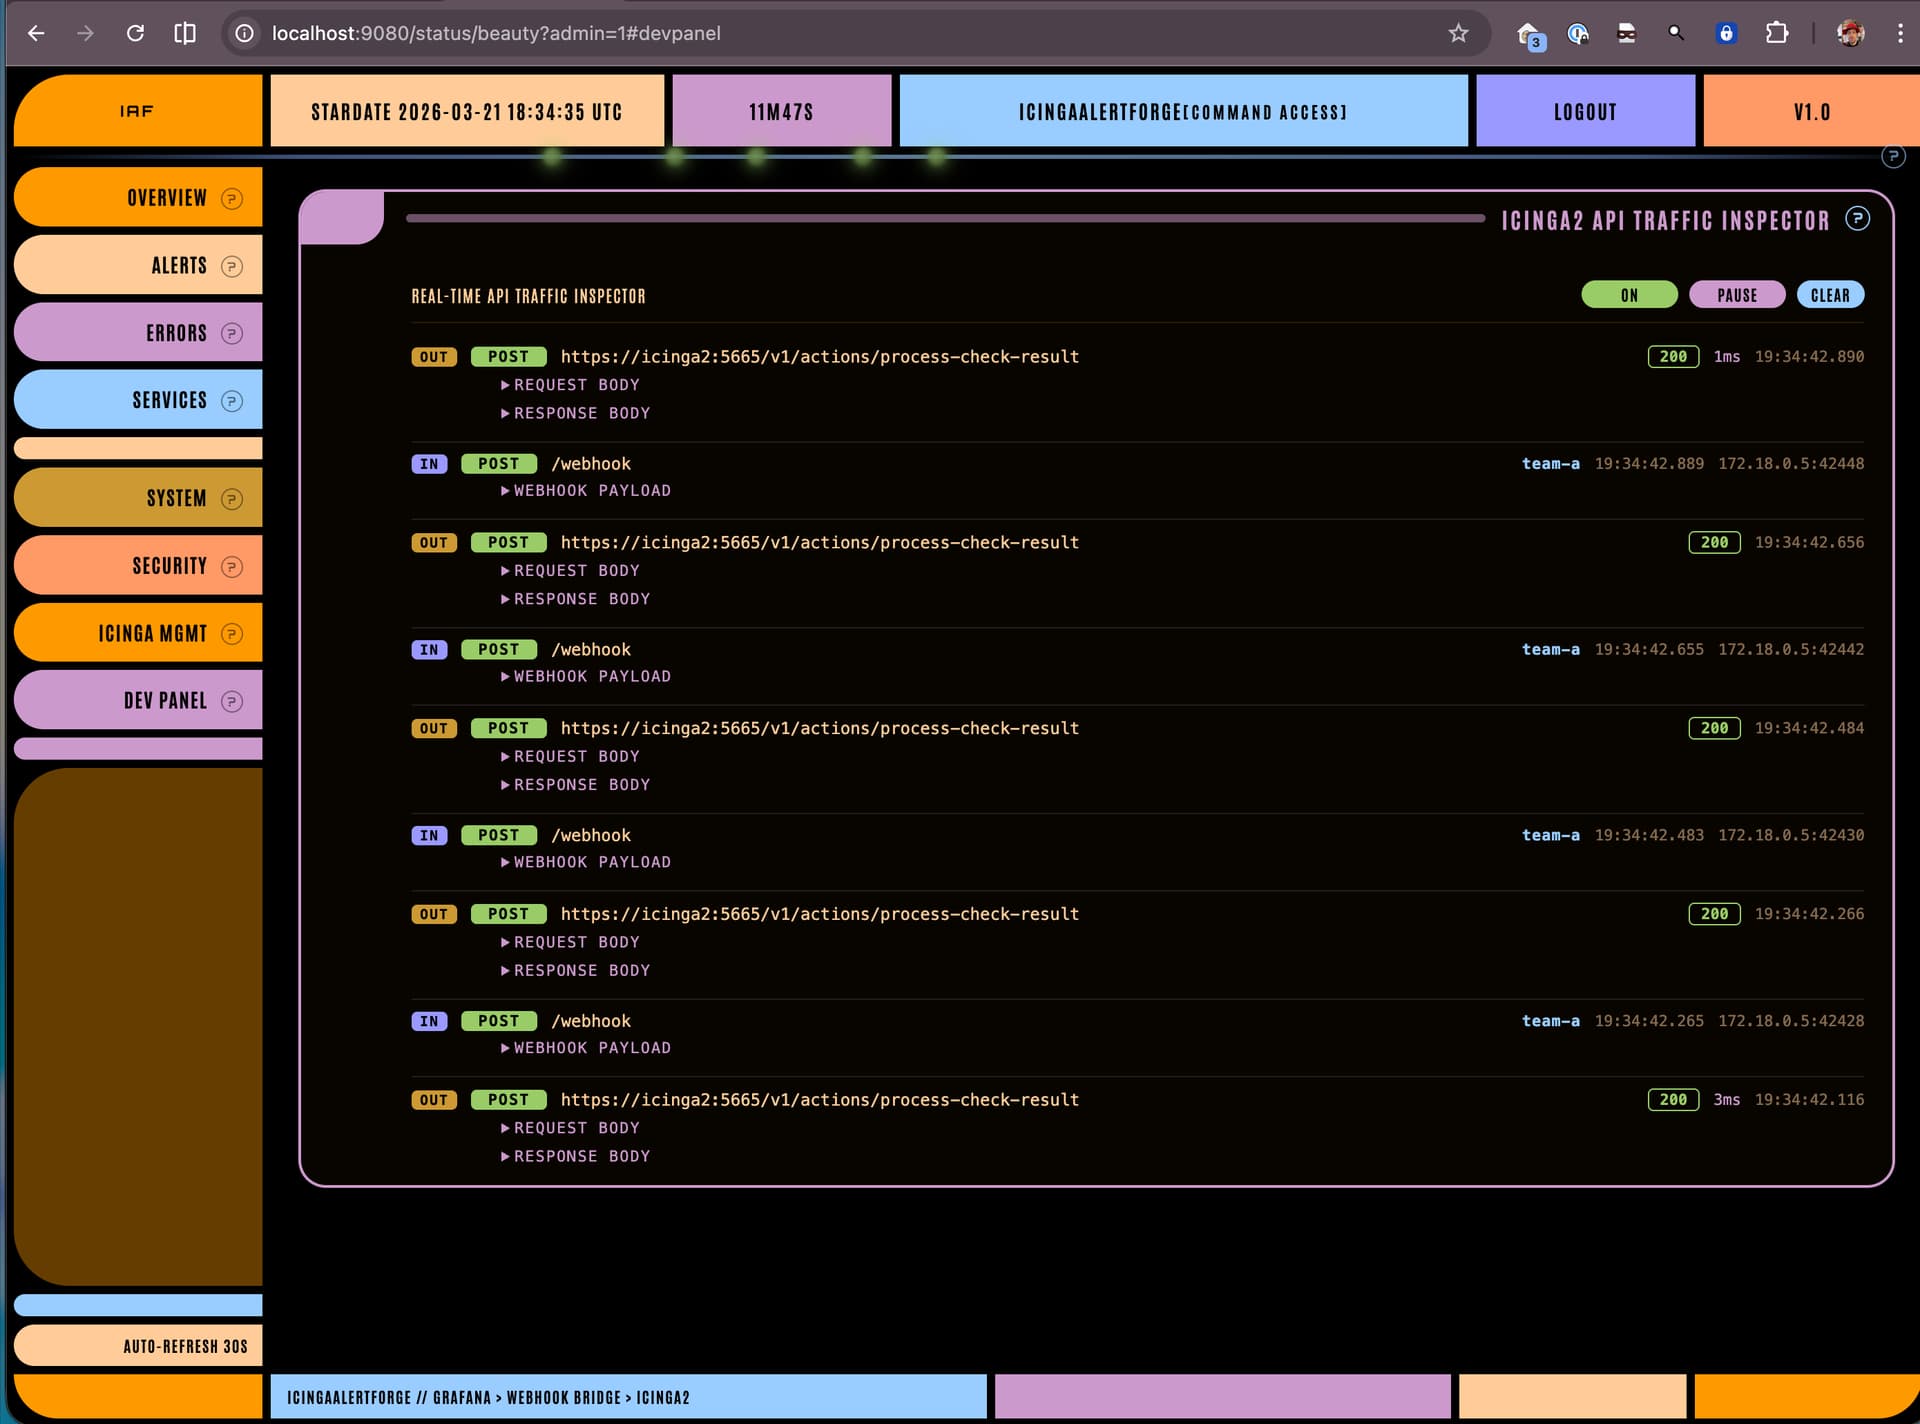
The service includes a “Beauty Panel” for live inspection of history, cache state, and managed services. For those who want to test it locally, I have provided a complete Docker Compose environment with Grafana, Prometheus, and Icinga2. The project is open-source and available on GitHub: https://github.com/dzaczek/IcingaAlertingForge.
**
The working schema is as follows: we create “dummy” devices (hosts) in Icinga2, which can be named for example “TEAM-A”. When a webhook is received, the bridge routes alerts from Grafana to the corresponding team host. Each individual alert is then created and updated as a separate, dedicated service under that host.**
And a dedicated status panel for everyone who knows that space is the final frontier… It allows you to monitor all your ‘starships’ (team hosts) and their missions (services) in one place.