Hello.
My environment
Docker images:
- icingadb:1.1.0
- icingaweb2:2.11.4
- icinga2:2.13.6
- icingadbredis:7.0.4
- influxdb2:2.6.1
- grafana:9.1.5
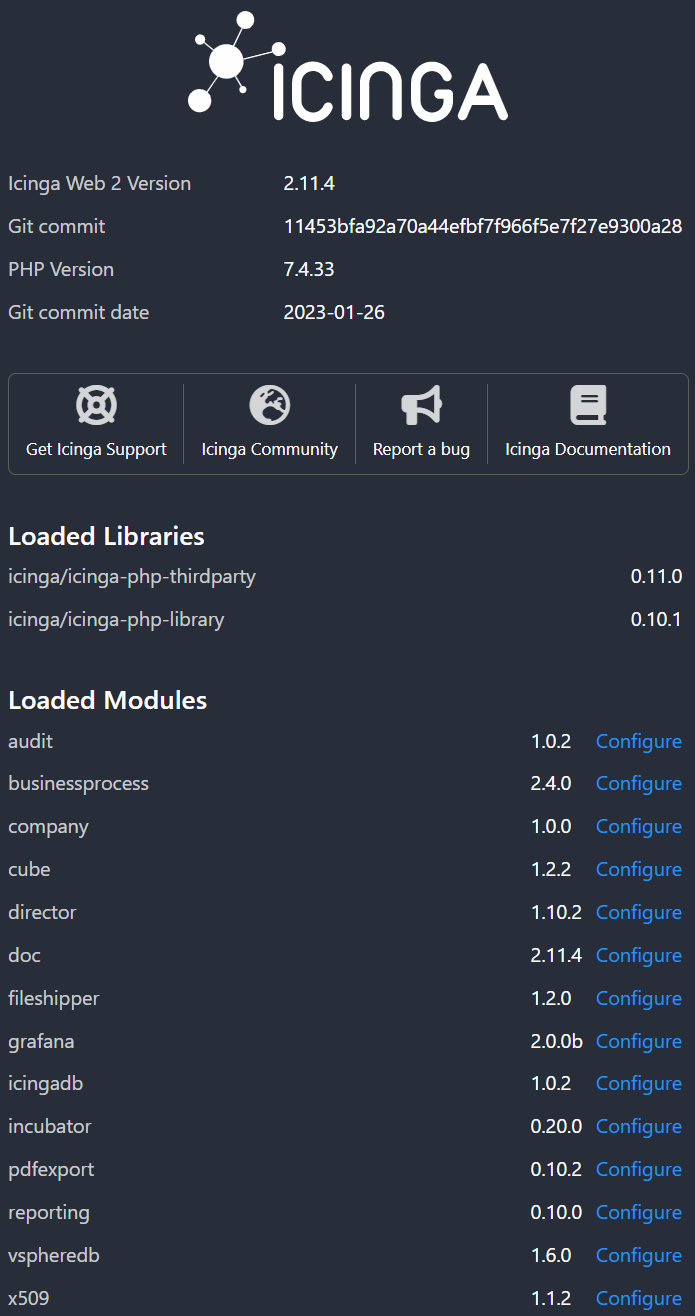
About details:
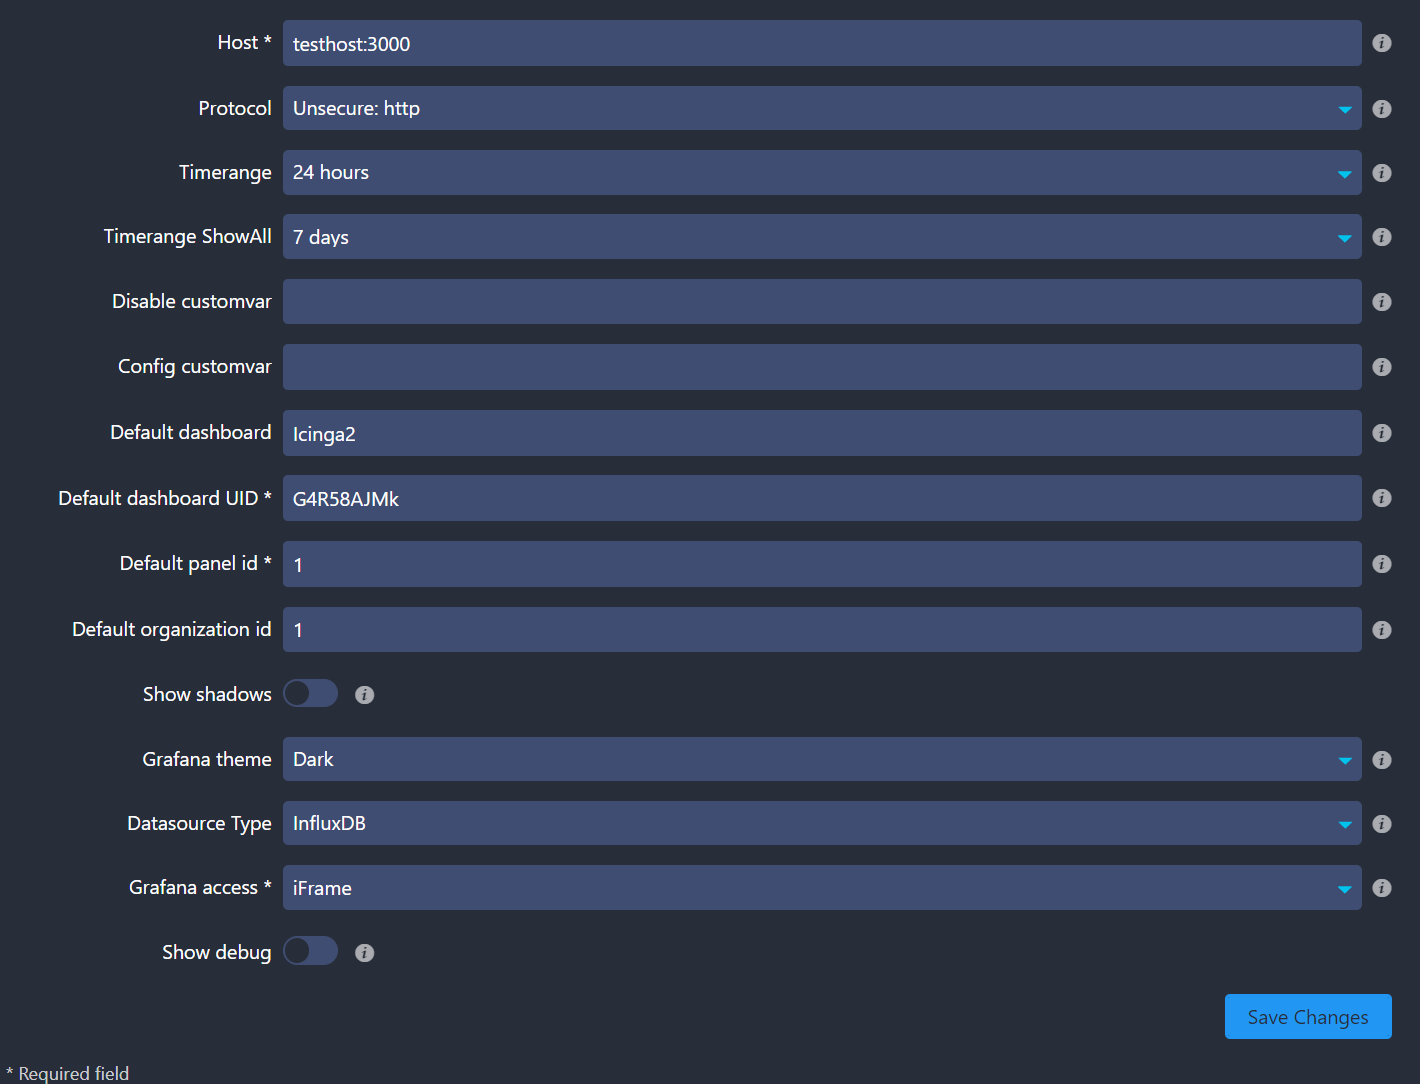
Grafana module configuration:
My goal
Add a Grafana performance graph to dashboard.
My problem
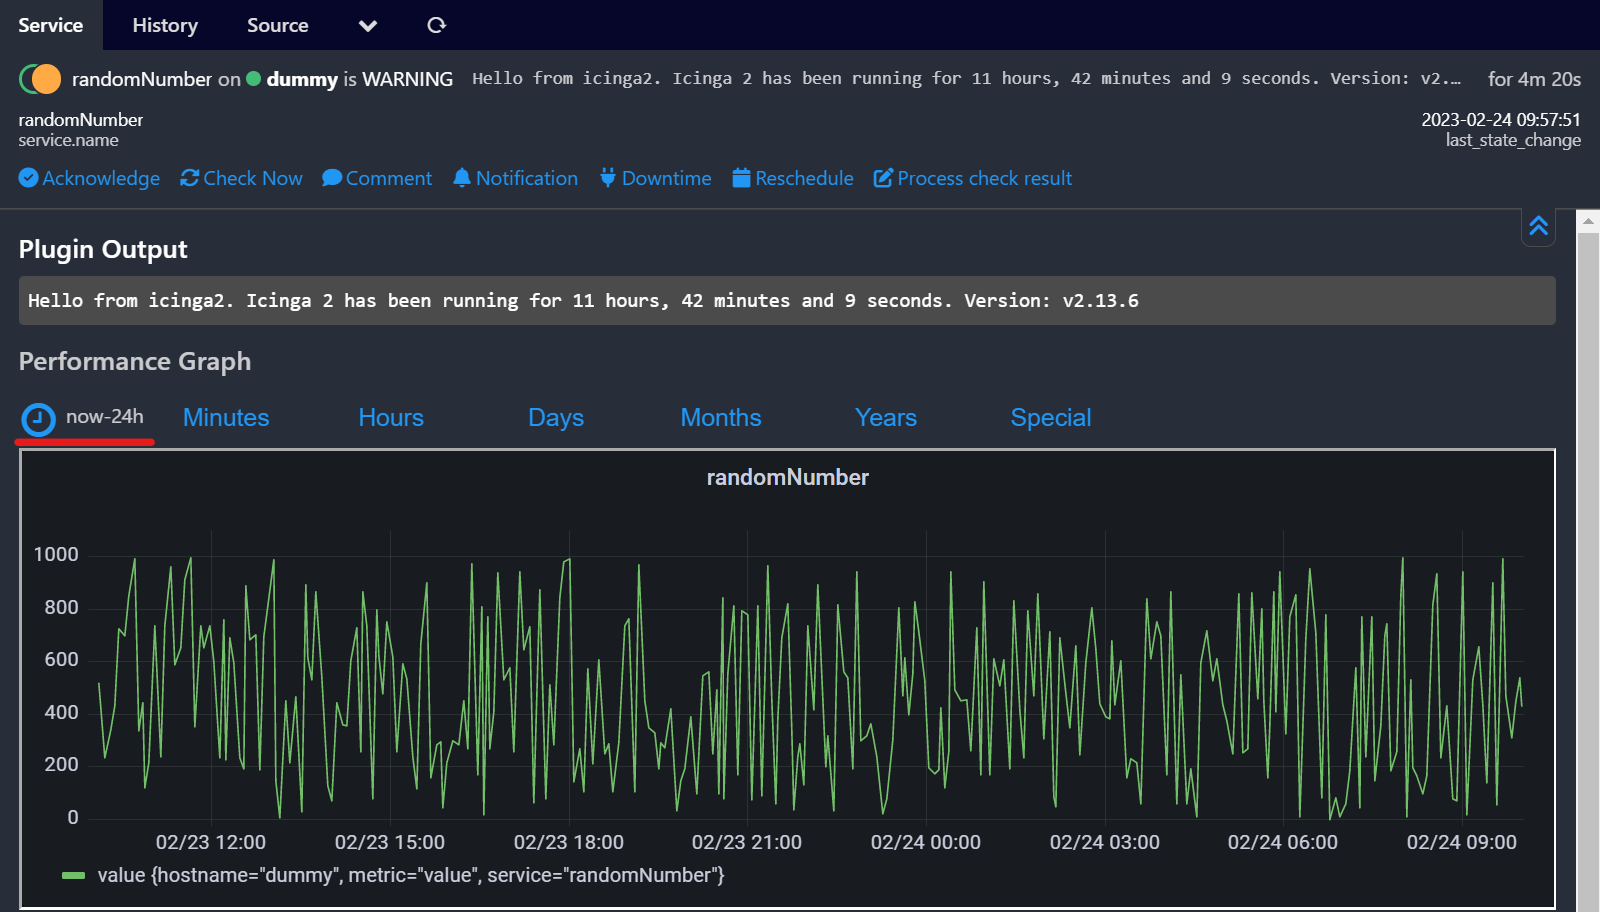
Selecting “Add graph to Dashboard”.
(1) “http://testhost:8080/icingadb/service?name=randomNumber&host.name=dummy”
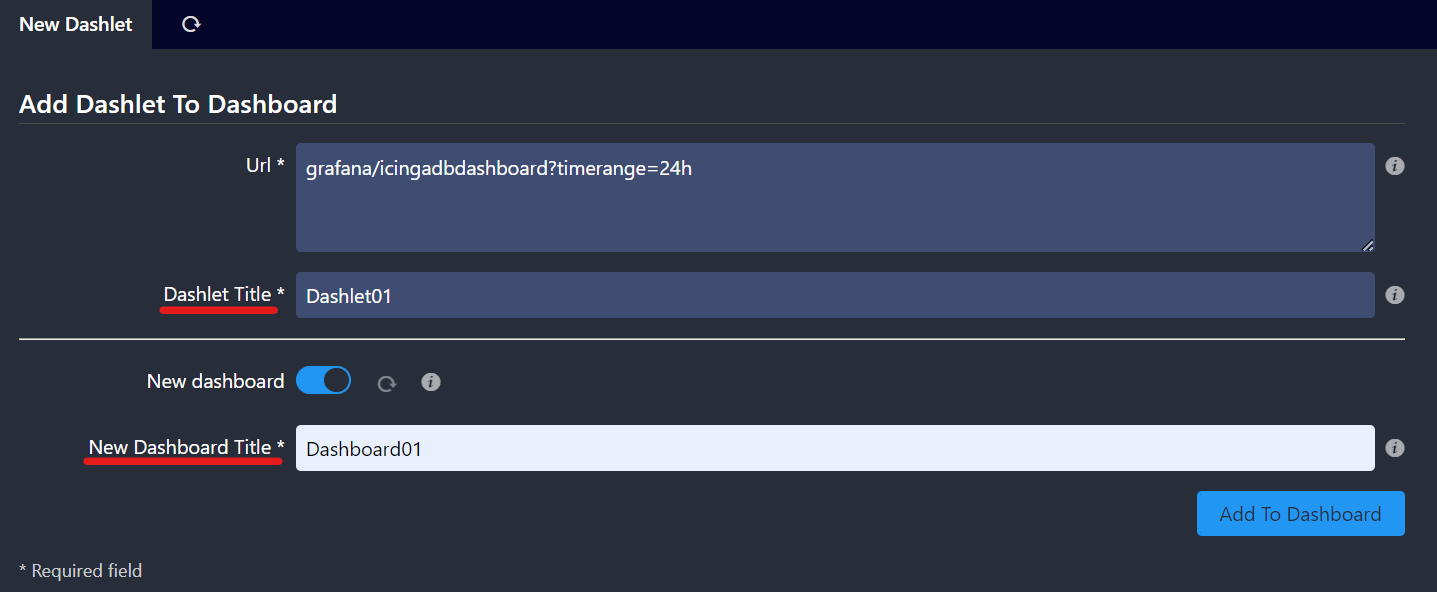
Completing “Dashlet Title” and “New Dashboard Title” fields.
(2) “http://testhost:8080/icingadb/services#!/dashboard/new-dashlet?url=grafana%2Ficingadbdashboard%3Ftimerange%3D24h”
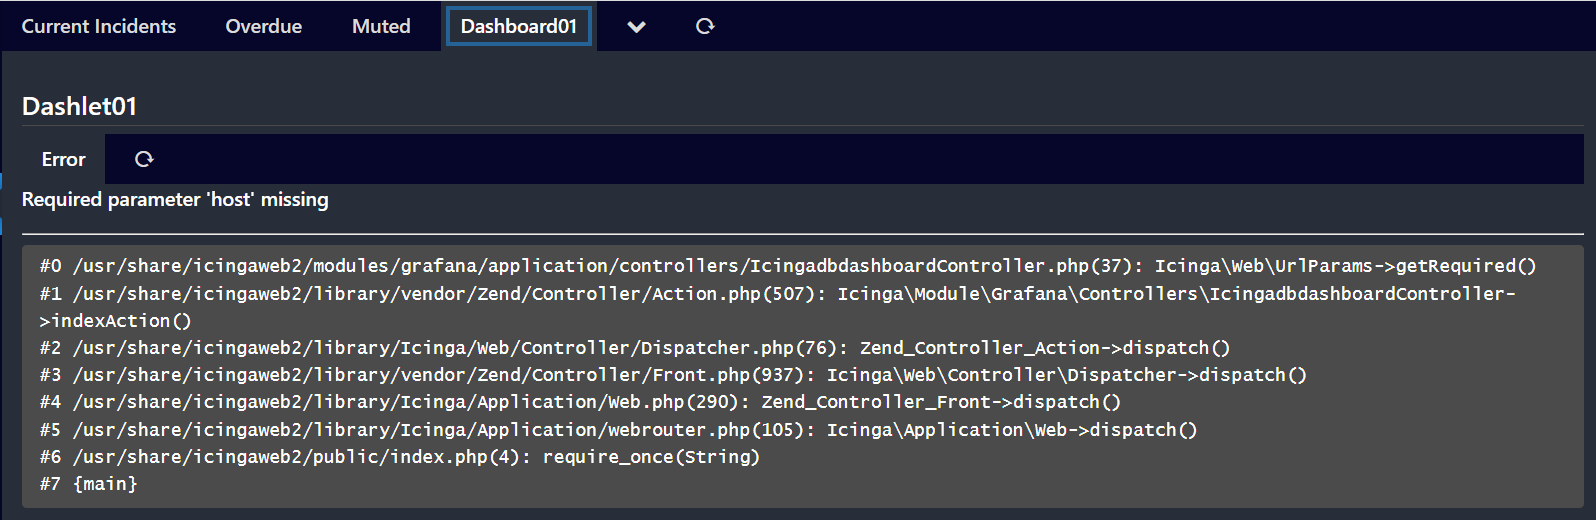
Getting error.
(3) “http://testhost:8080/icingadb/services#!/dashboard?pane=Dashboard01”
My question
How to add a Grafana performance graph to dashboard ?
Best regards
JK