I’d like to build a report showing the uptime of my Icinga service checks. I.e. the checks are indeed run every 10min, 24/7/365.
I see API exposes only a live stream. If there will be a connection loss, I won’t be able to read the past data.
Is there a way to read the past service check results?
(the one I see is reading directly from IDO, Servicechecks Table. But from one hand it’s not generally good to be reading from an internal datastore, and from the other - the docs say “This table is usually trimmed periodically by the IDO2DB daemon, as it would otherwise grow to an enormous size.”
So is it possible it trims, and my periodic poller will loose the ability to read the data…
)
The history you’ll in icingaweb2 isn’t enough? With the possability of the filters you can build you Report. Or you try the icingaweb2 module https://github.com/Icinga/icingaweb2-module-reporting. But with this module we have no experience. But I think other users could help here
you mean icingaweb2/monitoring/list/eventhistory?timestamp%3E=-10%20hours&host_name=my_host&service=my_service" ?
No that’s not enough, because that way I’m getting not all check results, seems just the ones when the state got changed (OK → Warn, etc), anyway for the last 10h I get only 4-5 response rows while the checks are run every 10min.
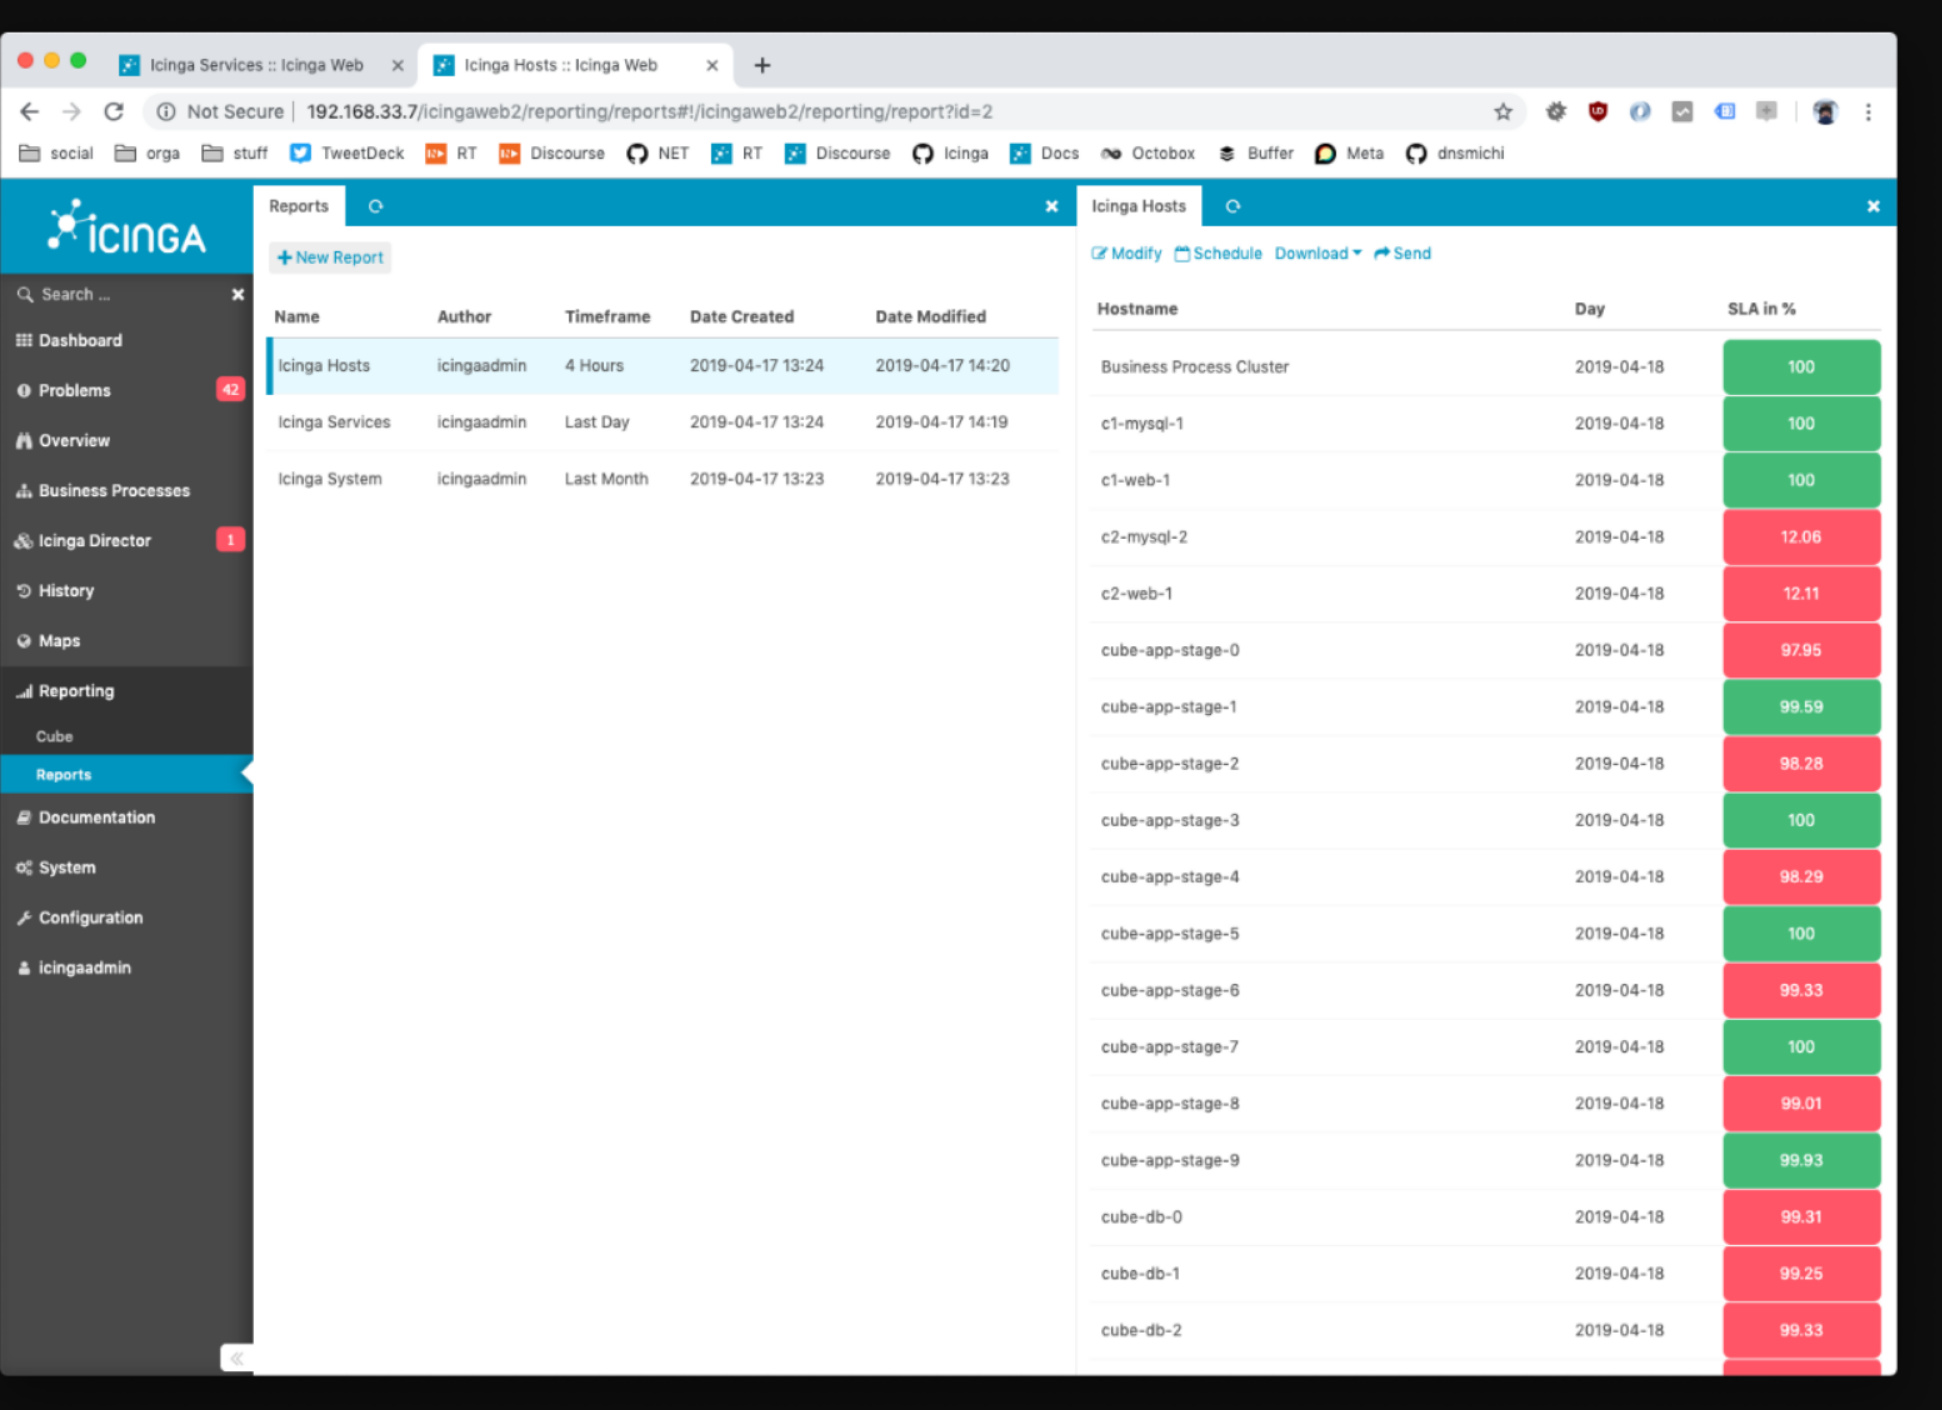
icingaweb2-module-reporting, as per the docs, looks limited, you can only have the built-in reports, like
I don’t care about the associated extra data, like the time it took to run the check; or the check output.
To clarify the intent: the Icinga checks are configured to run every 10 minutes. I’d like to make sure they indeed have been run.
So periodically, like hourly, some job would pull the data, and check that every 10min there is a record during the past hour.
If, say, in an hour there are only 3 records instead of 6, the report would show uptime=50% for that hour.
Dirty: You could parse the icinga2.log for checks (not 100% sure)
even dirtier: activate the compatlog (old nagios-style logging) and parse it
Better: install influxdb, activate the influxwriter feature and performance data processing.
The data in influx contains everything you need, check timestamps and latency
Avoid the servicechecks table at all cost inside the IDO database backend, this will greatly reduce your performance and won’t help much. Instead, use a modern TSDB like Graphite/InfluxDB and store that data. If you need a greater resolution with old data retention, adjust the default values for that. Keep in mind though that these backends need tuning and maintenance on their own.