Applying commands/command template to hosts, e.g., check_https or check_http --ssl

OK now I get a test notification and

## zones.d/master/notification_apply.conf

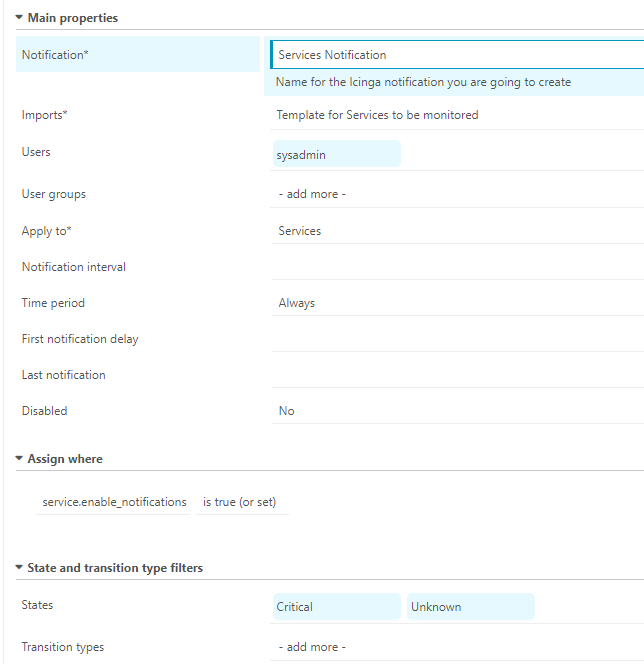
apply Notification "Services Notification" to Service 
{ 
import "[Template for Services to be monitored]" 
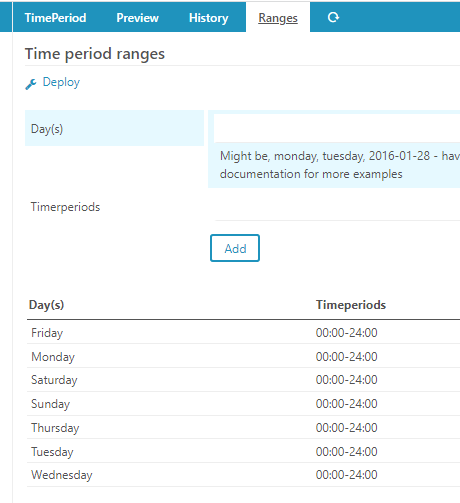
period = "Always" 
assign where service.enable_notifications 
states = [ Critical, Unknown ] users = [ "sysadmin" ] 
}

icinga2 object list --type=notification|more
Object 'ourschool.edu!Service Template for Server Monitoring Disk Usage!Services Notification' of type 'Notification':
  % declared in '/var/lib/icinga2/api/packages/director/1df86275-35fe-403b-b734-0df845305c68/zones.d/master/notification_apply.conf', lines 1:0-1:52
  * __name = "ourschool.edu!Service Template for Server Monitoring Disk Usage!Services Notification"
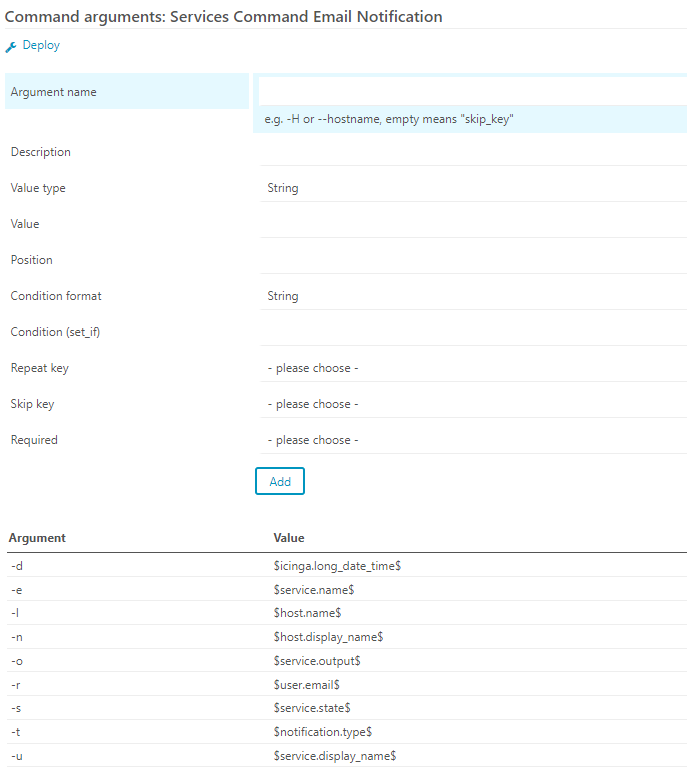
  * command = "mail-service-notification"
    % = modified in '/var/lib/icinga2/api/packages/director/1df86275-35fe-403b-b734-0df845305c68/zones.d/master/notification_templates.conf', lines 2:5-2:41
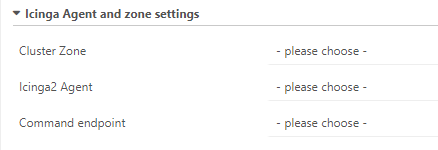
  * command_endpoint = ""
  * host_name = "ourschool.edu"
    % = modified in '/var/lib/icinga2/api/packages/director/1df86275-35fe-403b-b734-0df845305c68/zones.d/master/notification_apply.conf', lines 1:0-1:52
  * interval = 1800
  * name = "Services Notification"
  * package = "director"
    % = modified in '/var/lib/icinga2/api/packages/director/1df86275-35fe-403b-b734-0df845305c68/zones.d/master/notification_apply.conf', lines 1:0-1:52
  * period = "Always"
    % = modified in '/var/lib/icinga2/api/packages/director/1df86275-35fe-403b-b734-0df845305c68/zones.d/master/notification_templates.conf', lines 3:5-3:21
    % = modified in '/var/lib/icinga2/api/packages/director/1df86275-35fe-403b-b734-0df845305c68/zones.d/master/notification_apply.conf', lines 4:5-4:21
  * service_name = "Service Template for Server Monitoring Disk Usage"
    % = modified in '/var/lib/icinga2/api/packages/director/1df86275-35fe-403b-b734-0df845305c68/zones.d/master/notification_apply.conf', lines 1:0-1:52
  * source_location
    * first_column = 0
    * first_line = 1
    * last_column = 52
    * last_line = 1
    * path = "/var/lib/icinga2/api/packages/director/1df86275-35fe-403b-b734-0df845305c68/zones.d/master/notification_apply.conf"
  * states = [ "Critical", "Unknown" ]
    % = modified in '/var/lib/icinga2/api/packages/director/1df86275-35fe-403b-b734-0df845305c68/zones.d/master/notification_templates.conf', lines 4:5-4:31
    % = modified in '/var/lib/icinga2/api/packages/director/1df86275-35fe-403b-b734-0df845305c68/zones.d/master/notification_apply.conf', lines 6:5-6:34
  * templates = [ "Services Notification", "Template for Services to be monitored" ]
    % = modified in '/var/lib/icinga2/api/packages/director/1df86275-35fe-403b-b734-0df845305c68/zones.d/master/notification_apply.conf', lines 1:0-1:52
    % = modified in '/var/lib/icinga2/api/packages/director/1df86275-35fe-403b-b734-0df845305c68/zones.d/master/notification_templates.conf', lines 1:0-1:60
  * times = null
  * type = "Notification"
  * types = null
  * user_groups = [ "admin" ]
    % = modified in '/var/lib/icinga2/api/packages/director/1df86275-35fe-403b-b734-0df845305c68/zones.d/master/notification_templates.conf', lines 5:5-5:29
  * users = [ "sysadmin" ]
    % = modified in '/var/lib/icinga2/api/packages/director/1df86275-35fe-403b-b734-0df845305c68/zones.d/master/notification_templates.conf', lines 6:5-6:26
    % = modified in '/var/lib/icinga2/api/packages/director/1df86275-35fe-403b-b734-0df845305c68/zones.d/master/notification_apply.conf', lines 7:5-7:26
  * vars = null
  * zone = "master"
    % = modified in '/var/lib/icinga2/api/packages/director/1df86275-35fe-403b-b734-0df845305c68/zones.d/master/notification_apply.conf', lines 1:0-1:52

But I never get an email when a service is showing down, e.g., systemctl stop icinga2 on an agent. Why aren’t the email alerts going out other than via a test in the GUI?

Here is a log snip from icinga2.log:

[2021-11-08 15:40:56 -0500] information/Checkable: Checkable 'ourschool.edu!Service Template for Server Monitoring Web https' has 1 notification(s). Checking filters for type 'Problem', sends will be logged.
[2021-11-08 15:41:31 -0500] information/ApiListener: New client connection from [::ffff:150.108.64.65]:54024 (no client certificate)
[2021-11-08 15:41:31 -0500] information/HttpServerConnection: Request: GET /v1/ (from [::ffff:150.108.64.65]:54024), user: root, agent: , status: OK).
[2021-11-08 15:41:31 -0500] information/HttpServerConnection: Request: GET /v1/ (from [::ffff:150.108.64.65]:54024), user: root, agent: , status: OK).
[2021-11-08 15:41:31 -0500] information/HttpServerConnection: HTTP client disconnected (from [::ffff:150.108.64.65]:54024)
[2021-11-08 15:41:33 -0500] information/ApiListener: New client connection from [::ffff:150.108.64.65]:54026 (no client certificate)
[2021-11-08 15:41:33 -0500] information/HttpServerConnection: Request: GET /v1/ (from [::ffff:x.x.x.x]:54026), user: root, agent: , status: OK).
[2021-11-08 15:41:33 -0500] information/HttpServerConnection: Request: GET /v1/ (from [::ffff:x.x.x.x]:54026), user: root, agent: , status: OK).
[2021-11-08 15:41:33 -0500] information/HttpServerConnection: HTTP client disconnected (from [::ffff:x.x.x.x]:54026)

I’m trying suggestions from [this tutorial], (NSM2021/Agenda/AlertsIcinga2Email – Learn Workshops)


When I try to send a notification with the force option no email is sent and these are the logs:

 warning/PluginNotificationTask: Notification command for object 'host.myschool.edu!Service Template for Server Monitoring System Load' (PID: 2040128, arguments: '/etc/icinga2/scripts/mail-service-notification.sh' '-4' 'x.x.x.x' '-6' '' '-b' 'root' '-c' '$host.display_name$' '-d' '2021-11-08 16:48:08 -0500' '-e' 'Service Template for Server Monitoring System Load' 'myschool.edu' '-n' 'host' '-o' 'CRITICAL - load average: 7.50, 6.83, 5.31' '-r' 'me@mychool.edu' '-s' 'CRITICAL' '-t' 'CUSTOM' '-u' 'Service Template for Server Monitoring System Load') terminated with exit code 1, output: Required parameter 'HOSTDISPLAYNAME' is missing.

Required parameters:
  -d LONGDATETIME ($icinga.long_date_time$)
  -e SERVICENAME ($service.name$)
  -l HOSTNAME ($host.name$)
  -n HOSTDISPLAYNAME ($host.display_name$)
  -o SERVICEOUTPUT ($service.output$)
  -r USEREMAIL ($user.email$)
  -s SERVICESTATE ($service.state$)
  -t NOTIFICATIONTYPE ($notification.type$)
  -u SERVICEDISPLAYNAME ($service.display_name$)

Optional parameters:
  -4 HOSTADDRESS ($address$)
  -6 HOSTADDRESS6 ($address6$)
  -b NOTIFICATIONAUTHORNAME ($notification.author$)
  -c NOTIFICATIONCOMMENT ($notification.comment$)
  -i ICINGAWEB2URL ($notification_icingaweb2url$, Default: unset)
  -f MAILFROM ($notification_mailfrom$, requires GNU mailutils (Debian/Ubuntu) or mailx (RHEL/SUSE))
  -v ($notification_sendtosyslog$, Default: false)

But HOSTDISPLAYNAME is clearly there. I can’t find in any place where the argument for the '-c' '$host.display_name$' part of the log entry being set.

Are there two values after -e?

Good eye yes, there appears to be 2 values: '-e' 'Service Template for Server Monitoring System Load' 'myschool.edu' '-n' 'host' '-o'

Where else could the -e option being set?

I think you might be mixing host notifications and service notifications here.

DOWN is the state of a host.
For this you would need to configure a host notification.

The whole command creation part from the tutorial is not needed, because you already have both host and service commands present in the director and the work without problems.
Just use those in your notification templates.
Currently you are extending/overwriting the pre-existing commands with additional parameters from you newly created command and that leads to problems (my guess)

My bad, I meant service is showing CRITICAL.

Yes I can send the notification via “Send Notifications” but the email never goes out all I see in the logs are:

[2021-11-09 09:28:03 -0500] information/HttpServerConnection: HTTP client disconnected (from [::ffff:150.108.64.65]:54762)
[2021-11-09 09:28:03 -0500] information/Checkable: Checkable 'ourschool.edu!Service Template for Server Monitoring Web https' has 1 notification(s). Checking filters for type 'Problem', sends will be logged.
[2021-11-09 09:28:42 -0500] information/ConfigObject: Dumping program state to file '/var/lib/icinga2/icinga2.state'
[2021-11-09 09:28:52 -0500] information/WorkQueue: #6 (ApiListener, SyncQueue) items: 0, rate:  0/s (0/min 0/5min 0/15min);
[2021-11-09 09:28:52 -0500] information/WorkQueue: #5 (ApiListener, RelayQueue) items: 0, rate: 1.23333/s (74/min 158/5min 159/15min);
[2021-11-09 09:28:52 -0500] information/IdoMysqlConnection: Pending queries: 5 (Input: 3/s; Output: 3/s)

Enable the debug log with icinga2 feature enable debuglog, restart icinga and try again.
Then you will see more information about what is happening when the notification is being sent.

From icinga2.log:

[2021-11-09 09:57:13 -0500] notice/ApiListener: Relaying 'event::SetNextCheck' message
[2021-11-09 09:57:13 -0500] notice/ApiListener: Relaying 'event::CheckResult' message
[2021-11-09 09:57:13 -0500] notice/Checkable: State Change: Checkable 'testserver.ourschool.edu!Service Template for Server Monitoring Web https' hard state change from CRITICAL to OK detected.
[2021-11-09 09:57:13 -0500] notice/ApiListener: Relaying 'event::SendNotifications' message
[2021-11-09 09:57:13 -0500] information/Checkable: Checkable 'testserver.ourschool.edu!Service Template for Server Monitoring Web https' has 1 notification(s). Checking filters for type 'Recovery', sends will be logged.
[2021-11-09 09:57:13 -0500] notice/ApiListener: Relaying 'event::SetForceNextNotification' message
[2021-11-09 09:57:13 -0500] notice/Notification: Attempting to send notifications of type 'Recovery' for notification object 'testserver.ourschool.edu!Service Template for Server Monitoring Web https!Services Notification'.
[2021-11-09 09:57:13 -0500] notice/Notification: Not sending notifications for notification object 'testserver.ourschool.edu!Service Template for Server Monitoring Web https!Services Notification': not in timeperiod 'Always'
[2021-11-09 09:57:13 -0500] notice/ApiListener: Relaying 'event::SetSuppressedNotificationTypes' message

from debug.log:

[2021-11-09 09:57:14 -0500] debug/IdoMysqlConnection: Query: UPDATE icinga_servicestatus SET next_check = FROM_UNIXTIME(1636469833) WHERE service_object_id = 365
[2021-11-09 09:57:14 -0500] debug/IdoMysqlConnection: Query: UPDATE icinga_servicestatus SET acknowledgement_type = '0',  active_checks_enabled = '1',  check_command = 'http',  check_source = 'testserver.ourschool.edu',  check_timeperiod_object_id = 403,  check_type = '0',  current_check_attempt = '1',  current_notification_number = '0',  current_state = '0',  endpoint_object_id = 246,  event_handler_enabled = '1',  execution_time = '0.087564',  flap_detection_enabled = '0',  has_been_checked = '1',  instance_id = 1,  is_flapping = '0',  is_reachable = '1',  last_check = FROM_UNIXTIME(1636469833),  last_hard_state = '0',  last_hard_state_change = FROM_UNIXTIME(1636469833),  last_notification = FROM_UNIXTIME(1636408903),  last_state_change = FROM_UNIXTIME(1636469833),  last_time_critical = FROM_UNIXTIME(1636468083),  last_time_ok = FROM_UNIXTIME(1636469833),  last_time_unknown = FROM_UNIXTIME(1636052880),  last_time_warning = FROM_UNIXTIME(1635964631),  latency = '0',  long_output = '',  max_check_attempts = '1',  next_check = FROM_UNIXTIME(1636470129),  next_notification = FROM_UNIXTIME(1636470522),  normal_check_interval = '5',  notifications_enabled = '1',  original_attributes = 'null',  output = 'HTTP OK: HTTP/1.1 200 OK - 1288 bytes in 0.078 second response time ',  passive_checks_enabled = '1',  percent_state_change = '22.200000',  perfdata = 'time=0.078186s;;;0.000000 size=1288B;;;0',  problem_has_been_acknowledged = '0',  process_performance_data = '1',  retry_check_interval = '1',  scheduled_downtime_depth = '0',  service_object_id = 365,  should_be_scheduled = '1',  state_type = '1',  status_update_time = FROM_UNIXTIME(1636469833) WHERE service_object_id = 365
[2021-11-09 09:57:14 -0500] debug/IdoMysqlConnection: Query: INSERT INTO icinga_statehistory (check_source, current_check_attempt, endpoint_object_id, instance_id, last_hard_state, last_state, long_output, max_check_attempts, object_id, output, state, state_change, state_time, state_time_usec, state_type) VALUES ('testserver.ourschool.edu', '1', 246, 1, '0', '2', '', '1', 365, 'HTTP OK: HTTP/1.1 200 OK - 1288 bytes in 0.078 second response time ', '0', '1', FROM_UNIXTIME(1636469833), '444664', '1')

So the big clue is: Not sending notifications for notification object 'testserver.ourschool.edu!Service Template for Server Monitoring Web https!Services Notification': not in timeperiod 'Always'

Can you point me to an Always or 24x7 timeperiod template and/or setting?

What’s wrong with my timeperiod?

[2021-11-09 10:45:19 -0500] critical/config: Error: Validation failed for object '24x7' of type 'TimePeriod'; Attribute 'ranges': Invalid time specification 'Friday': Invalid time specification: Friday
Location: in [stage]/zones.d/director-global/timeperiods.conf: 4:5-12:5
[stage]/zones.d/director-global/timeperiods.conf(2):     import "legacy-timeperiod"
[stage]/zones.d/director-global/timeperiods.conf(3):     display_name = "24x7 timeperiod"
[stage]/zones.d/director-global/timeperiods.conf(4):     ranges = {
                                                         ^^^^^^^^^^
[stage]/zones.d/director-global/timeperiods.conf(5):         "Friday" = "00:00-24:00"
                                                     ^^^^^^^^^^^^^^^^^^^^^^^^^^^^^^^^
[stage]/zones.d/director-global/timeperiods.conf(6):         "Monday" = "00:00-24:00"
                                                     ^^^^^^^^^^^^^^^^^^^^^^^^^^^^^^^^
[stage]/zones.d/director-global/timeperiods.conf(7):         "Saturday" = "00:00-24:00"
                                                     ^^^^^^^^^^^^^^^^^^^^^^^^^^^^^^^^^^
[stage]/zones.d/director-global/timeperiods.conf(8):         "Sunday" = "00:00-24:00"
                                                     ^^^^^^^^^^^^^^^^^^^^^^^^^^^^^^^^
[stage]/zones.d/director-global/timeperiods.conf(9):         "Thursday" = "00:00-24:00"
                                                     ^^^^^^^^^^^^^^^^^^^^^^^^^^^^^^^^^^
[stage]/zones.d/director-global/timeperiods.conf(10):         "Tuesday" = "00:00-24:00"
                                                      ^^^^^^^^^^^^^^^^^^^^^^^^^^^^^^^^^
[stage]/zones.d/director-global/timeperiods.conf(11):         "Wednesday" = "00:00-24:00"
                                                      ^^^^^^^^^^^^^^^^^^^^^^^^^^^^^^^^^^^
[stage]/zones.d/director-global/timeperiods.conf(12):     }
                                                      ^^^^^
[stage]/zones.d/director-global/timeperiods.conf(13): }
[stage]/zones.d/director-global/timeperiods.conf(14): 
[2021-11-09 10:45:19 -0500] critical/config: 1 error
[2021-11-09 10:45:19 -0500] critical/cli: Config validation failed. Re-run with 'icinga2 daemon -C' after fixing the config.

zones.d/director-global/timeperiods.conf

object TimePeriod "24x7" { import "[legacy-timeperiod](https://ourschool.edu/icingaweb2/director/timeperiod?name=legacy-timeperiod)" display_name = "24x7 timeperiod" ranges = { "Friday" = "00:00-24:00" "Monday" = "00:00-24:00" "Saturday" = "00:00-24:00" "Sunday" = "00:00-24:00" "Thursday" = "00:00-24:00" "Tuesday" = "00:00-24:00" "Wednesday" = "00:00-24:00" } }

Edit: holy cow, lower case for the day names fixed it.

1 Like

My last question, how do you monitor a network attached storage device like a Drobo or VessRAID, something that has an IP, just to check via ICMP only? I can’t install on agent on these. Is there a FAQ for this?

If all you want to do is check the device by ICMP, use the ping service check
or the hostalive check. There’s not a lot of difference between them

https://icinga.com/docs/icinga-2/latest/doc/10-icinga-template-library/#ping
https://icinga.com/docs/icinga-2/latest/doc/10-icinga-template-
library/#hostalive

Personally I would prefer to check the services being offered by such a device
(NFS / SMB / iSCSI / whatever it is they do) rather than just checking whether
its network stack is responding.

Antony.

Thanks. How do I add a host without an agent in Director?

The Vessraid uses iscsi and Drobo has an autofs/NFS share. Do I have to use ssh plugin to get those mounts?

Create a new host template in the Director and simply don’t configure the agent settings.
image
All those hosts importing the template will then be checked by your master.

Concerning your devices and how to monitor them, I can’t help. Never heard of those.
Often there is something available on the web though.
Search the web for “device monitoring” or “device icinga” or “device nagios” will most likely bring something up.
Other good plugin sources are exchange.icinga.com and exchange.nagios.org

But as this thread get’s more and more crowded with different topics/problem I would suggest you open a new one if you encounter new problems.

Maybe also take a look a some icinga Director talks/presentations which explain the basics:

Beware, they are both quite old and the interface will look a bit different, the base features haven’t changed dramatically though.

I found check_promise_vtrak and the maintainer updated it for our NAS!

Is there an older Nagios plugin to handle a CentOS6 server? Getting this error:
/usr/lib64/nagios/plugins/check_disk: /lib64/libc.so.6: version GLIBC_2.33’ not found (required by /usr/lib64/nagios/plugins/check_disk)`